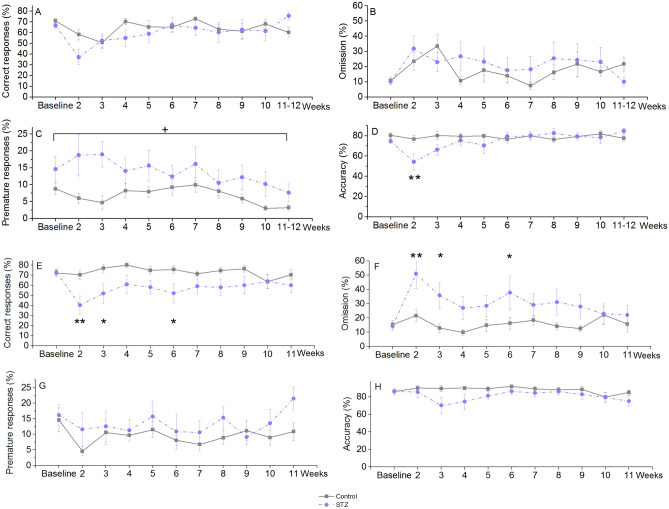
Figure 3.
Learning performance of icv. STZ-injected (‘STZ’) and vehicle-treated (‘control’) rats in the 5CSRTT at various time points post-injection. Means ± SEM values are shown. (A, B, C, D) Results of old animals. + : p = 0.023 significant treatment effect in percentage of premature responses (F(1, 21) = 5.98). **: p < 0.01 significant difference vs control on the same day (post-hoc Duncan test following repeated measures ANOVA with significant Day × treatment interaction: F(10, 200) = 2.53, p = 0.007) for percentage of accuracy. (E, F, G, H) Results of young animals. *, **: p < 0.05, p < 0.01 significant difference between groups on the same day (post-hoc Duncan test following repeated measures ANOVA with significant Day × treatment interaction: F(10, 220) = 2.20, p = 0.019 for percentage of correct responses and F(10,220) = 2.06, p = 0.029 for omissions). Group size of old STZ-treated rats: n = 12 at Week 2, n = 11 at Week 3–9, n = 10 at Week 10, n = 8 at Week 11–12.

