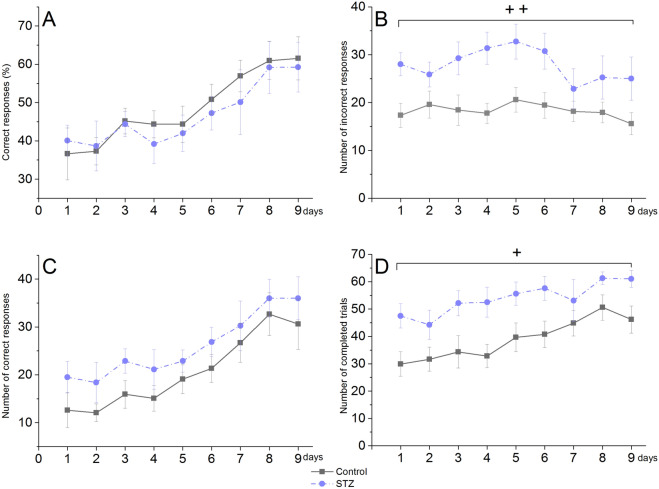
Figure 6.
Pairwise visual discrimination performance of icv. STZ-injected (‘STZ’) and vehicle-treated (‘control’) old rats in a touchscreen apparatus in the post-injection period of Week 12–14. Means ± SEM values are shown. (A) Percentage of correct responses (B) Number of incorrect responses. + + : p = 0.005 significant treatment effect (F(1,18) = 10.28). (C) Number of correct responses. (D) Number of completed trials. + : p = 0.018 significant treatment effect (F(1,18) = 6.83). Group size of old STZ-treated rats: n = 8.

