Figure 7.
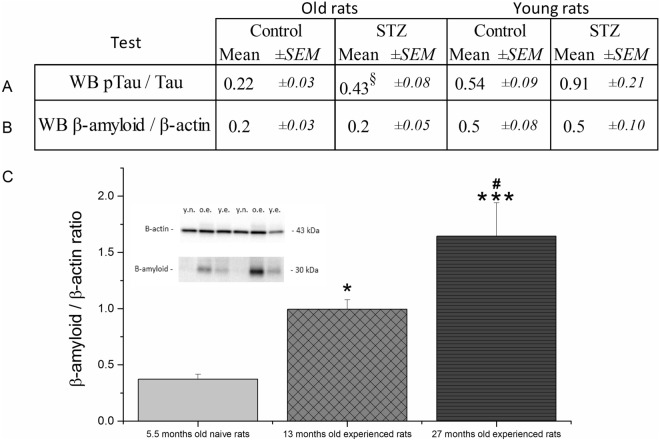
Results of the western blot assays. (A) Phospho-tau/tau ratio. ‘Old rats’ column: §:p = 0.016 significant difference vs control ((Mann–Whitney U-test U = 18; because of variance inhomogeneity non-parametric test was used), effect size: 1.23. Group size of old STZ-treated rats: n = 9. (B) β-amyloid level ns. Group size of old STZ-treated rats: n = 10. (C) Comparison of tissue protein levels of β-amyloid in 5 month old (young naïve), 12 month old (young experienced) and 25 month old (old experienced) rats measured by western blot. Means ± SEM values are shown. *, ***: p < 0.05, p < 0.001 significant difference vs. young naïve rats, #: p < 0.05 significant difference vs. young experienced rats (post-hoc Duncan test following one way ANOVA (F(2, 24) = 10.09, p = 0.001). Group sizes are 9, 11 and 11 for young naïve (y.n.), young experienced (y.e.) and old experienced rats (o.e.), respectively. The inset shows representative blots; original complete blots are presented in Supplementary material, Figs. S2-S3.

