Fig. 3.
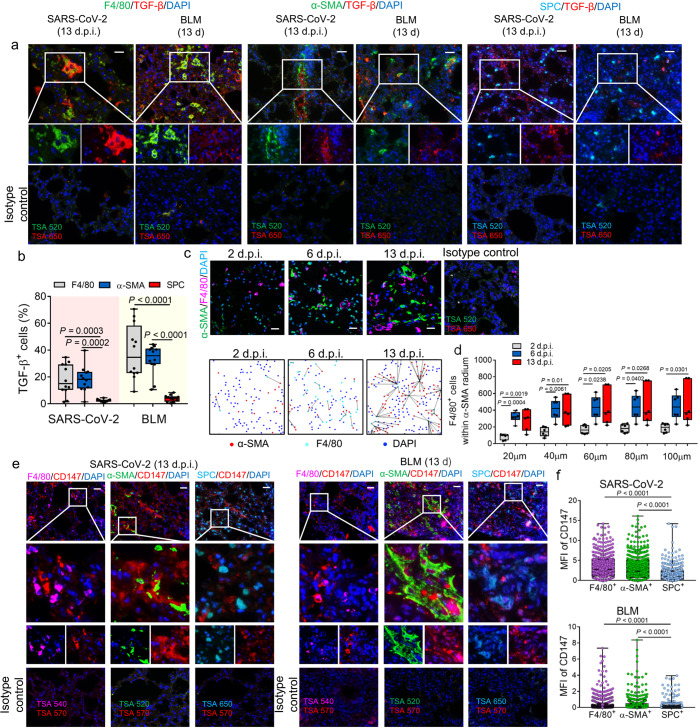
Activation of TGF-β-CD147 axis in fibroblasts in lungs of SARS-CoV-2-infected hCD147 mouse model. a Multiplex immunohistochemistry of lung tissue sections for F4/80, α-SMA, SPC and TGF-β from SARS-CoV-2-infected hCD147 mice at 13 d.p.i. and bleomycin-induced pulmonary fibrosis model at 13 days post-bleomycin administration. Scale bars, 50 μm. b Statistics of the percentages of cells expressing TGF-β in cells positive for F4/80, α-SMA or SFTPC (SPC). n = 12 images from three mice for each group, one-way ANOVA followed by multiple comparisons. c Representative multiplex immunohistochemistry staining of lung tissue sections from SARS-CoV-2-infected hCD147 mice for F4/80 and α-SMA from 2 to 13 d.p.i. Scale bars, 25 μm. d The number of F4/80+ macrophages within the 100 μm radium of α-SMA+ fibroblasts. n = 6 images (100 ×) from 3 mice for each group, one-way ANOVA followed by multiple comparisons. e Multiplex immunohistochemistry of lung tissue sections for CD147, F4/80, α-SMA and SPC from SARS-CoV-2-infected hCD147 mice at 13 d.p.i. and bleomycin-induced pulmonary fibrosis model at 13 days post-bleomycin administration. For samples from SARS-Cov2-infected hCD147 mice and bleomycin-treated C57BL/6J mice, anti-human CD147 antibody and anti-mouse CD147 antibody were used respectively. Scale bars, 50 μm. f Quantification of the mean fluorescence intensity (MFI) of CD147 in cells positive for F4/80, α-SMA or SPC. One-way ANOVA followed by multiple comparisons. In a, c and e, the rabbit or mouse IgG isotype control was used along with the staining of each molecule

