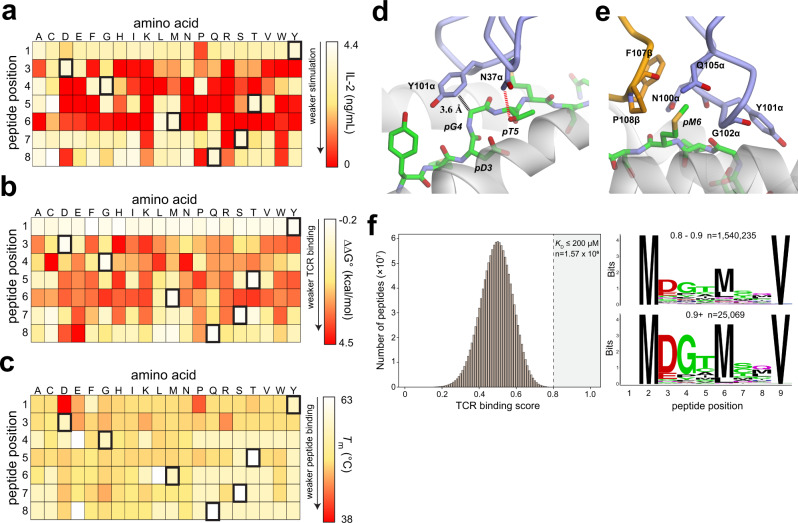
Fig. 5. Specificity within the TIL1383I-Tyr370D/HLA-A2 interface.
a TIL1383I shows high specificity for the Tyr370D peptide, as shown by a functional analysis of a positional scanning library of the peptide. Cells of the heat map indicate the extent of IL-2 released when TCR-transduced Jurkat cells were mixed with peptide-pulsed HLA-A2+ T2 cells. The color scale is on the right, with red indicating a loss of T-cell recognition. b Assessment of the positional scanning Tyr370D library by a novel TCR-binding assay with UV-exchanged peptide/HLA-A2 complexes. Cells of the heat map indicate the change in TCR-binding free energy relative to the wild-type peptide. The color scale is again on the right, with red indicating the largest reduction in binding free energy. There is good concurrence between the functional and binding analysis of the library. c Assessment of the UV-exchanged peptide/HLA-A2 library panel b using differential scanning fluorimetry to measure Tm values. Cells of the heat map indicate the Tm. The color scale is again on the right, with red indicating the largest reduction in Tm. Most peptide variants have little impact on Tm and thus peptide binding. d, e Structural determinants of high specificity for Asp3 through Met6 of the Tyr370D peptide in the interface with TIL1383I, showing how the interface would be intolerant to most substitutions at these peptide positions. f The binding data in panel b was used to generate a theoretical TCR-binding score for the 1.28 billion nonamers that retain methionine at position 2 and valine at position 9. The wild-type peptide has a score of 1.0, and the variant peptide scores have scores that are Gaussian-distributed around 0.5. There are 1.57 million peptides with a score of 0.8 or higher. The right panel shows sequence logos for the peptides in the top two deciles, along with the number of peptides. Data for panel f are provided as a Source Data file.

