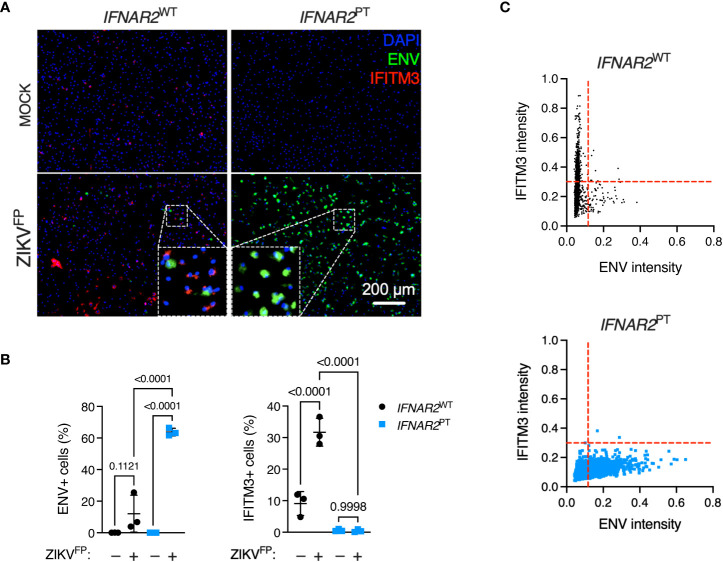
Figure 4.
IFN-I mediates paracrine protection of iPS-macrophages. (A) Immunofluorescence analysis of ZIKV ENV and IFITM3 expression in IFNAR2 PT (clone 11) and IFNAR2 WT (WT2) iPS-Mϕ (24 h.p.i. ZIKVFP MOI = 10.0). Representative images from one of three independent experiments are shown. Scale bar = 200 μm. (B) CellProfiler quantification of images in (A) showing proportion of cells expressing ZIKV ENV (left panel) or the ISG IFITM3 (right panel). Mean ± SD of n = 3 independent experiments, ANOVA with Sidak’s test for multiple comparisons. (C) CellProfiler analysis of single cell expression of ENV and IFITM3 in IFNAR2 WT and IFNAR2 PT iPS-Mϕ from images in (A), n = 2,434 (WT) cells and n = 2,202 (PT) cells respectively. Red dotted lines represent gating. Representative data from one of three independent experiments.

