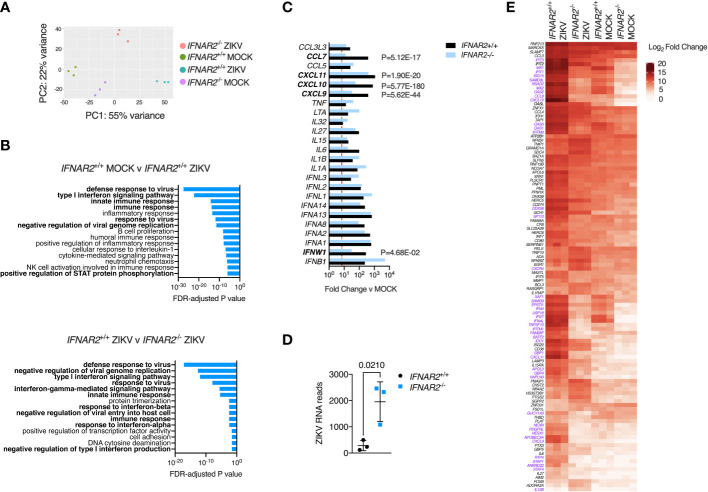
Figure 8.
IFN-I signalling dominates the transcriptional response to ZIKV infection. (A) Principal component analysis of RNA-seq data (24 h.p.i. ZIKVFP MOI = 1.0, n=3 biological replicates in isogenic IFNAR2 -/- [B5_2] and IFNAR2 +/+ [F8] iPS-Mϕ). (B) Gene ontology analysis (FDR<5%) of RNA-seq data, comparing mock v infected IFNAR2 +/+ iPS-Mϕ (top) and IFNAR2 -/- v IFNAR2 +/+ iPS-Mϕ (bottom). Selected pathways highlighted in bold. (C) Significantly differentially expressed DE IFN, chemokine and cytokine genes, comparing mock v ZIKV exposed conditions for IFNAR2 +/+ (black bars) or IFNAR2 -/- genotype (blue bars). Genes not reaching the DE threshold (Log2 FC ≥ 3, FDR < 5%) in both genotypes are not displayed. Red dotted line represents FC threshold (Log2 FC ≥ 3). FDR-adjusted P values are also included for significantly DE genes (in bold) comparing IFNAR2 -/- and IFNAR2 +/+ ZIKV exposed datasets. (D) Aligned ZIKV reads from data in (A), mean ± SD, t test. (E) Heatmap displaying expression of annotated macrophage-specific ISGs. Colour intensity reflects Log2 FC. Significantly DE genes (Log2 FC ≥ 3, FDR < 5%) are shown in purple text for the comparison of IFNAR2 -/- and IFNAR2 +/+ ZIKV exposed datasets.

