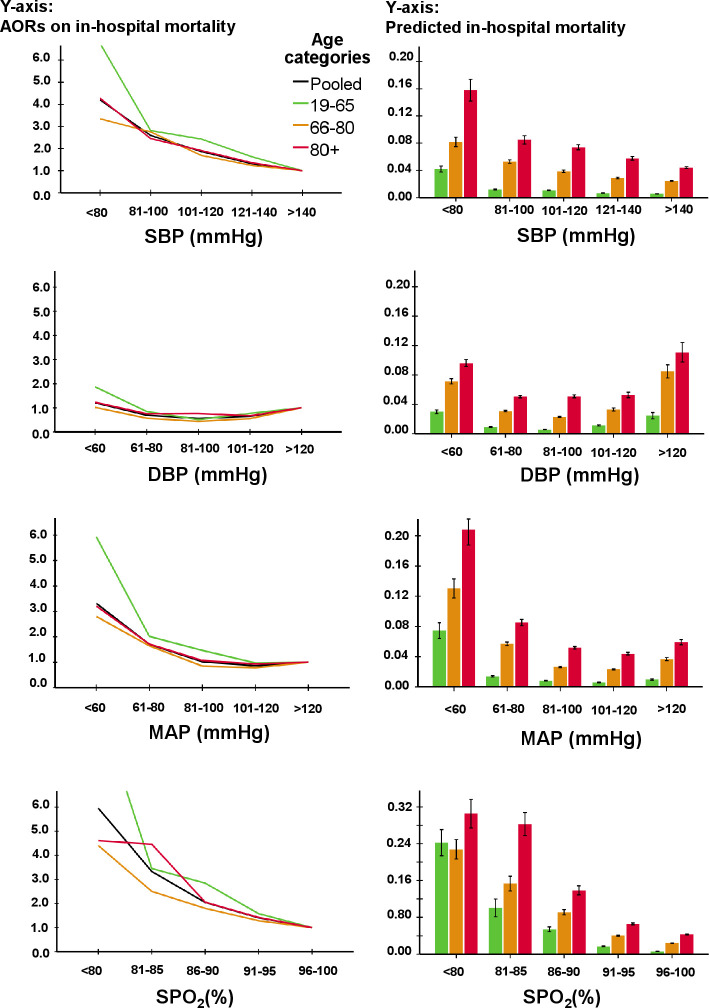
Figure 2.
AORs for SBP, DBP, MAP and SpO2 for in-hospital mortality (left side) and predicted in-hospital mortality (right side) as a function of vital signs in different age categories. Note that the black line is the pooled data of all three age categories together. The following potential confounders were entered in the model for in-hospital mortality through backward stepwise regression: age, gender, triage level, top 10 chief complaints, hospital, treating specialty, disposition, SpO2 (except for association of SpO2), temperature (except for association of temperature), Glasgow Coma Scale, lab tests, number of consultations in the emergency department and performed radiological test. AORs, adjusted odds ratios; DBP, diastolic blood pressure; MAP, mean arterial pressure; SBP, systolic blood pressure; SpO2, peripheral oxygen saturation.

