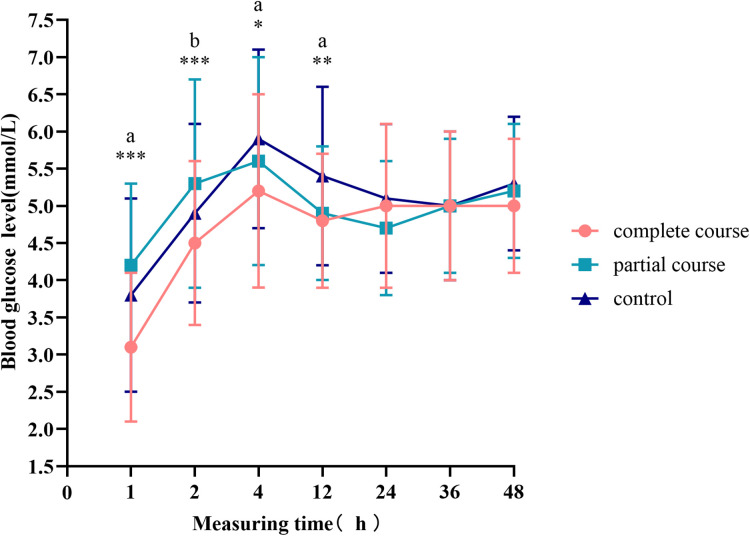
Figure 2.
Blood glucose levels at different time points. The curves represent the mean and standard deviation of blood glucose at a specific time point. Comparison of blood glucose levels among all groups, *p < 0.05, **p < 0.01, ***p < 0.001; ap < 0.0167 for the comparison of the complete course or partial course group with the control group. bp < 0.0167 for the comparison of the complete course group with the partial group.

