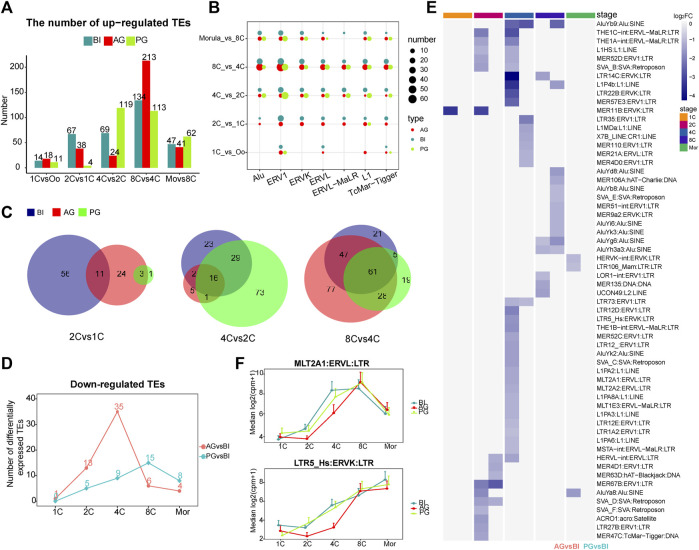
FIGURE 2.
Analysis of differential transposon of BI, AG, and PG embryos. (A) Histogram shows the numbers of upregulated differential transposons across consecutive developmental stages. The blue, red and green colors represent BI, AG, and PG embryos, respectively. (B) The number of differential transposons belonging to the seven transposon families during the early development of the three types of embryos. The color of the bubble represents the type of embryo, and the size represents the number. (C) The venn diagram shows the number of common elements of differential transposons during early embryonic development of three types of embryos. The red, green and blue colors represent BI, AG, and PG differential transposons, respectively. (D) The line chart shows the number of significantly different downregulated transposons between uniparental embryos and biparental embryos at each stage (p. adj ≦ 0.05 and |log2 (fold-change)| ≧ 1). (E) Heat map shows all the significantly different transposons in (D). Color represents the value of log2 (fold-change). (F) The expression levels of MLT2A1 and LTR5_Hs transposon in each developmental stage of three types of embryos.

