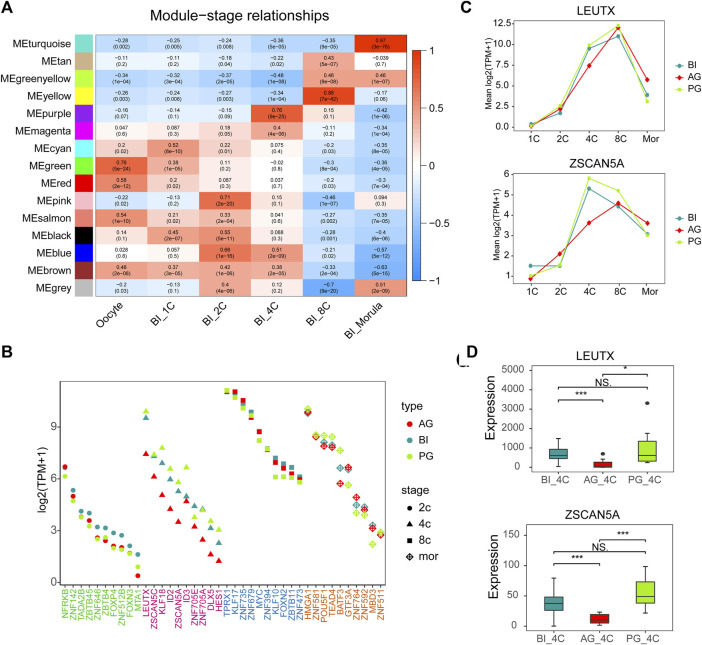
FIGURE 3.
Gene co-expression network analysis in BI embryos and comparison of key TFs. (A) Heatmap showing relationships between modules and specific stages. Each cell contains the value of correlation and p value. (B) Module visualization of network connections between all TFs in the pink, purple, yellow, turquoise modules and other genes which show a high positive correlation (PC ≥ 0.7). Highly connected intramodular hub TFs (top10) are indicated by a different color dot. (C) LEUTX and ZSCAN5A expression in each stage of three types of embryos. (D) The expression of ZSCAN5A and LEUTX in the three types of embryos at the 4-cell stage.

