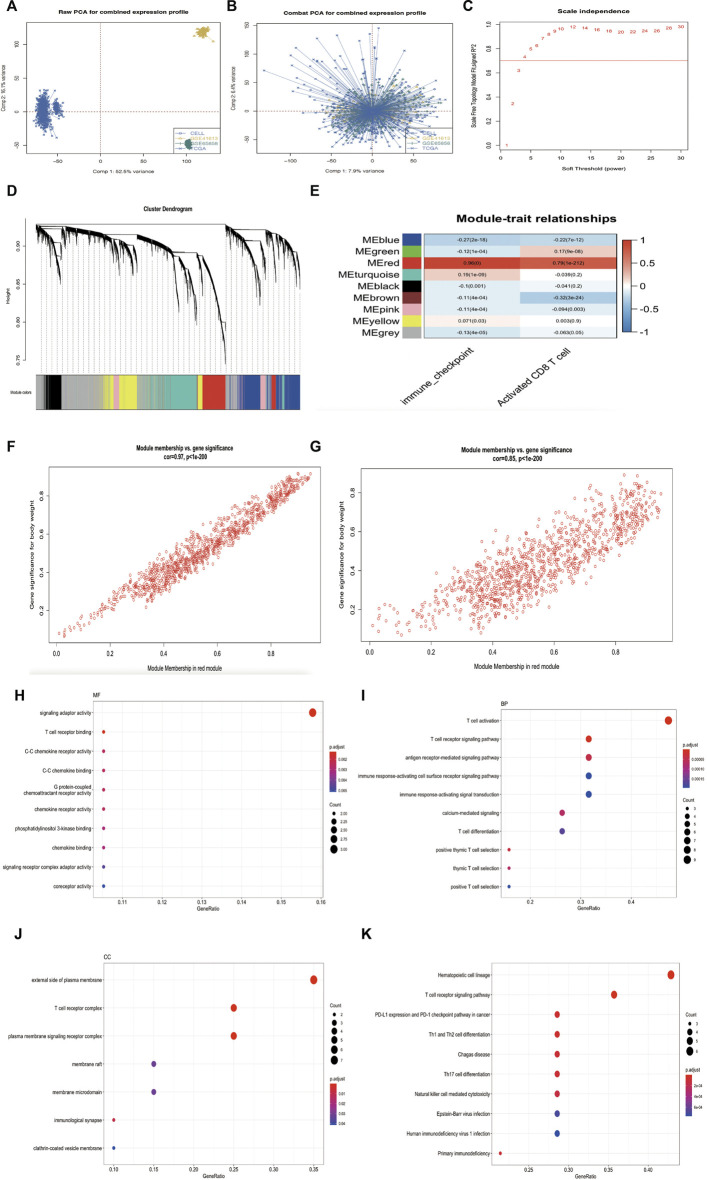
FIGURE 2.
(Continued). Research process. (A) Principal component analysis showed the gene expression profile in four HNSCC cohorts (GSE65858, GSE41613, TCGA, and CELL database) before elimination of the batch effects. (B) Principal component analysis showed the gene expression profile in four HNSCC cohorts (GSE65858, GSE41613, TCGA and CELL database) after elimination of the batch effects. (C) Analysis of network topology for various soft-thresholding powers. The red line indicates best pick soft threshold value = 4. (D) Cluster dendrogram of the differentially expressed genes based on different metrics. Each color indicates a single module of weighted co-expressed genes. (E) Correlation heatmap between the red module and activated CD8 T-cell and immune checkpoint signatures in combined cohort. Every column includes the concordance value and p value. (F–G) Correlation scatter map in both immune checkpoint signature (F) and activated CD8 T-cell signature of red module (G). (H–J) MF, BP, and CC analysis of 20 hub genes. (K) KEGG pathway enrichment analysis for 20 hub genes.

