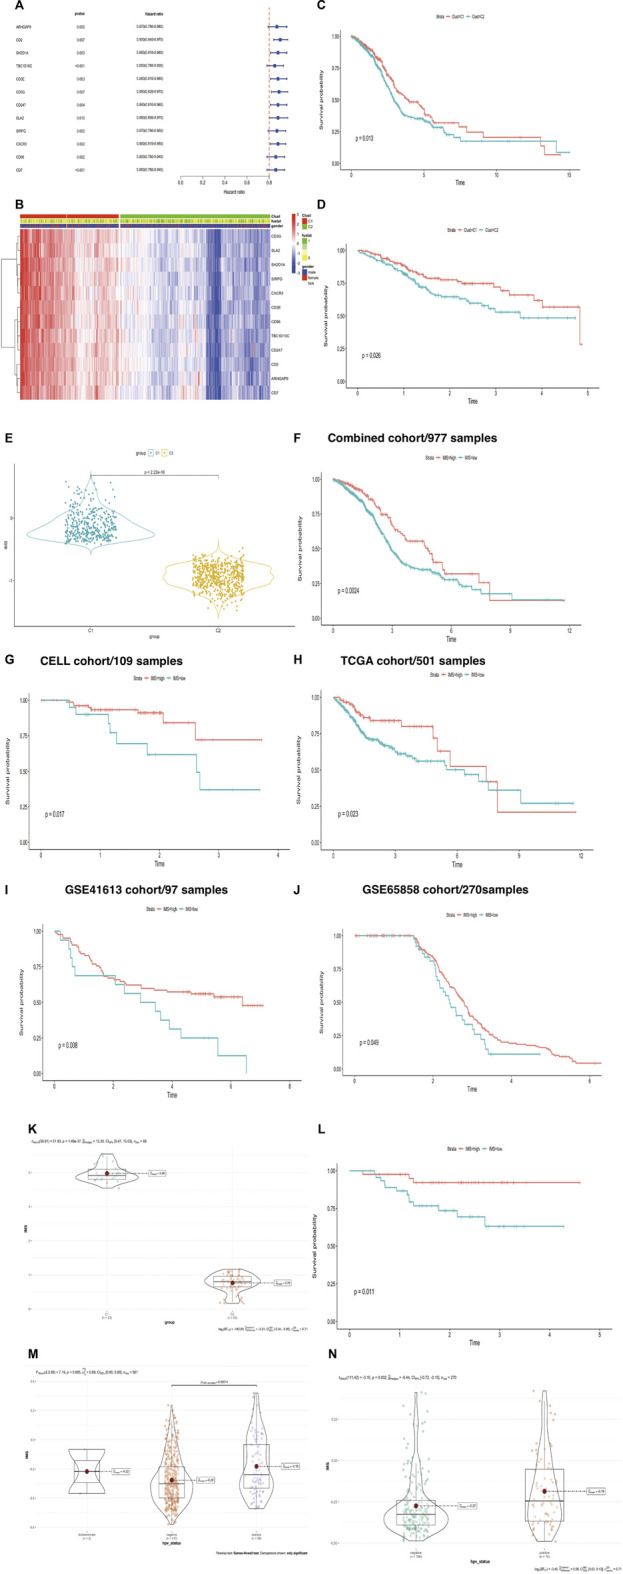
FIGURE 3.

(Continued). Construction of IMS could predict HNSCC patient survival and HPV status. (A) Univariate Cox regression analysis of about 12 genes. Hazard ratio (HR) < 1 represents that these genes were protective factors. (B) The heatmap displays the correlation between the two types of 12 genes and the expression variance, C1 (387 cases), C2 (589 cases), “1” means dead, “0” means alive, “fustat” means survival status. (C,D) The Kaplan-Meier plot exhibited significant statistic p value of overall survival rate among the two phenotypes of 12 genes in the combined (log rank p = 0.013) and TCGA cohorts (log rank p = 0.026), respectively. C1 was better than C2, unit of time (years). (E) Violin plot showed differential IMS expression in the C1 and C2 groups; p-value<2.22e-16. (F–J) The Kaplan-Meier plot exhibited significant statistical p value of overall survival rate among the two IMS phenotypes in the combined cohort (log rank p = 0.0024), CELL cohort (log rank p = 0.017), TCGA cohort (log rank p = 0.023), GSE41613 (log rank p = 0.008), and GSE65858 cohort (log rank p = 0.049), respectively, unit of time (years). (K) IMS in groups of GSE102349 cohort; high IMS group represents C1, low IMS group represents C2; p = 1.49e-37. (L) The Kaplan–Meier plot exhibited significant statistical p value of overall survival rate among the two IMS phenotypes in the external GSE102349 cohort. Unit of time (years). (M) IMS in the group of TCGA cohort; HPV-negative group (410), HPV-positive group (89); p = 0.00014. (N) IMS in the group of GSE65858 cohort; HPV-negative group (196), HPV-positive group (74); p = 0.002.
