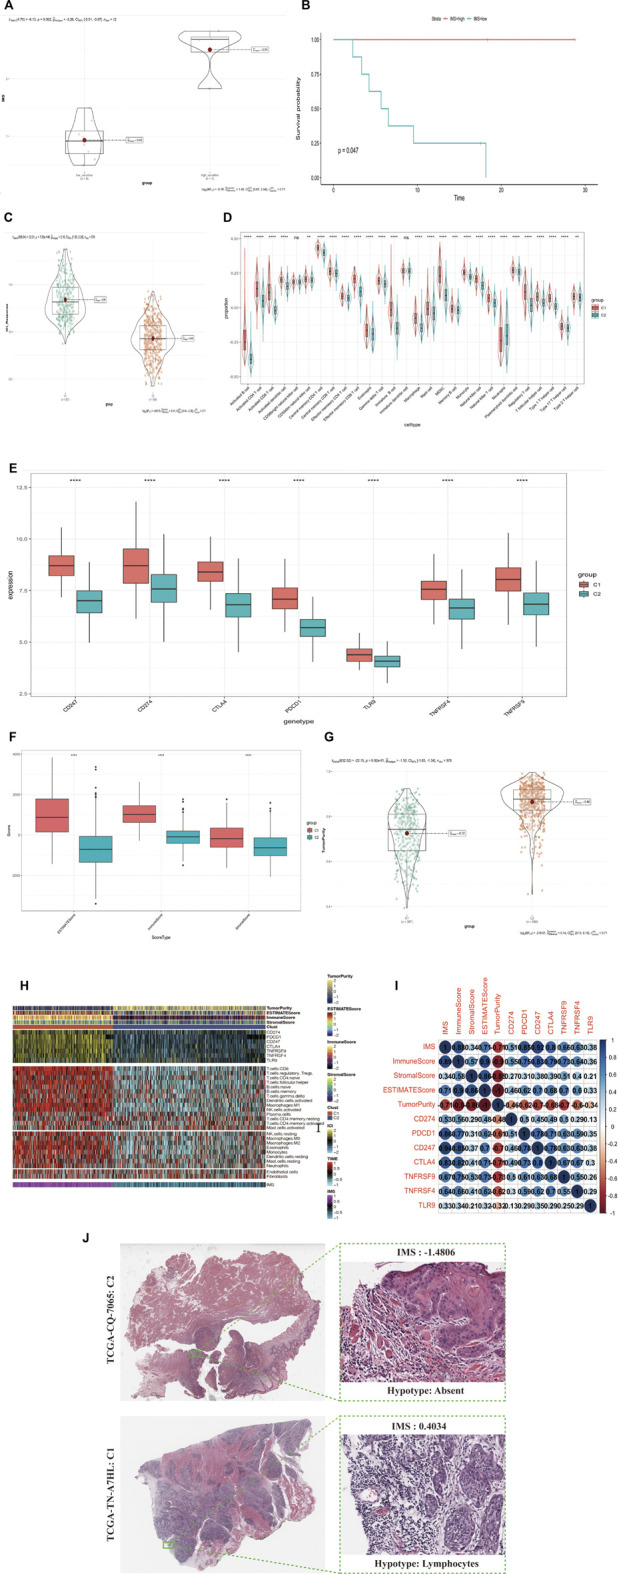
FIGURE 4.

(Continued). IMS could predict immunotherapy response and stratify the immunophenotype in HNSCC patients. (A) IMS in group of immunotherapy cohort; low-sensitivity group, high-sensitivity group; p = 0.002. (B) The Kaplan-Meier plot exhibited a statistical p value of overall survival rate among the two IMS phenotypes in the immunotherapy cohort. Unit of time (months). (C) IMS in groups of combined cohorts; high IMS group (387) represents Clust_C1, low IMS group (589) represents Clust_C2; p = 7.56e-146. (D) Enrichment of each immune cell type infiltrating in group of Clust; C1 (387 cases), C2 (589 cases); combined cohort; the asterisk represents the different p values (* <0.05; ** <0.01; *** <0.001, **** <0.0001). (E) Differential expression of immune checkpoint genes (CD247, CD274, CTLA4, PDCD1, TLR9, TNFRSF4, TNFRSF9) in group of Clust; C1 (387 cases) and C2 (589 cases); combined cohort; asterisks represent different p values (* <0.05; ** <0.01; *** <0.001, **** <0.0001). (F) ESTIMATEScore, ImmuneScore, and StromalScore in group of Clust; C1 (387 cases), C2 (589 cases); from combined cohort; asterisks represent different p values (* <0.05; ** <0.01; *** <0.001, **** <0.0001). (G) TumorPurity in group of Clust; C1 (387 cases), C2 (589 cases); combined cohort; p-value = 6.92e-81. (H) Complex-heatmap displays the landscape in the combined cohort; top panel displays the expression of genes involved in immune checkpoint targets; bottom panel displays the infiltration level of 24 microenvironment cell types. ESTIMATEScore, ImmuneScore, StromalScore, TumorPurity, C1 (387 cases), and C2 (589 cases) are labeled at top of heatmap, IMS are labeled at the bottom of the heatmap. (I) Bubble plot displays the correlation between the IMS, four score type, and seven immune checkpoint target genes. Blue means a positive correlation, red means a negative correlation, color depth and color size means the intensity of the correlation. The levels of correlation are marked with numbers. Upper triangular matrix represents Pearson correlation, lower triangular matrix represents Spearman correlation. (J) Image representing the pathological HE staining variation between the high and low IMS groups (TCGA database).
