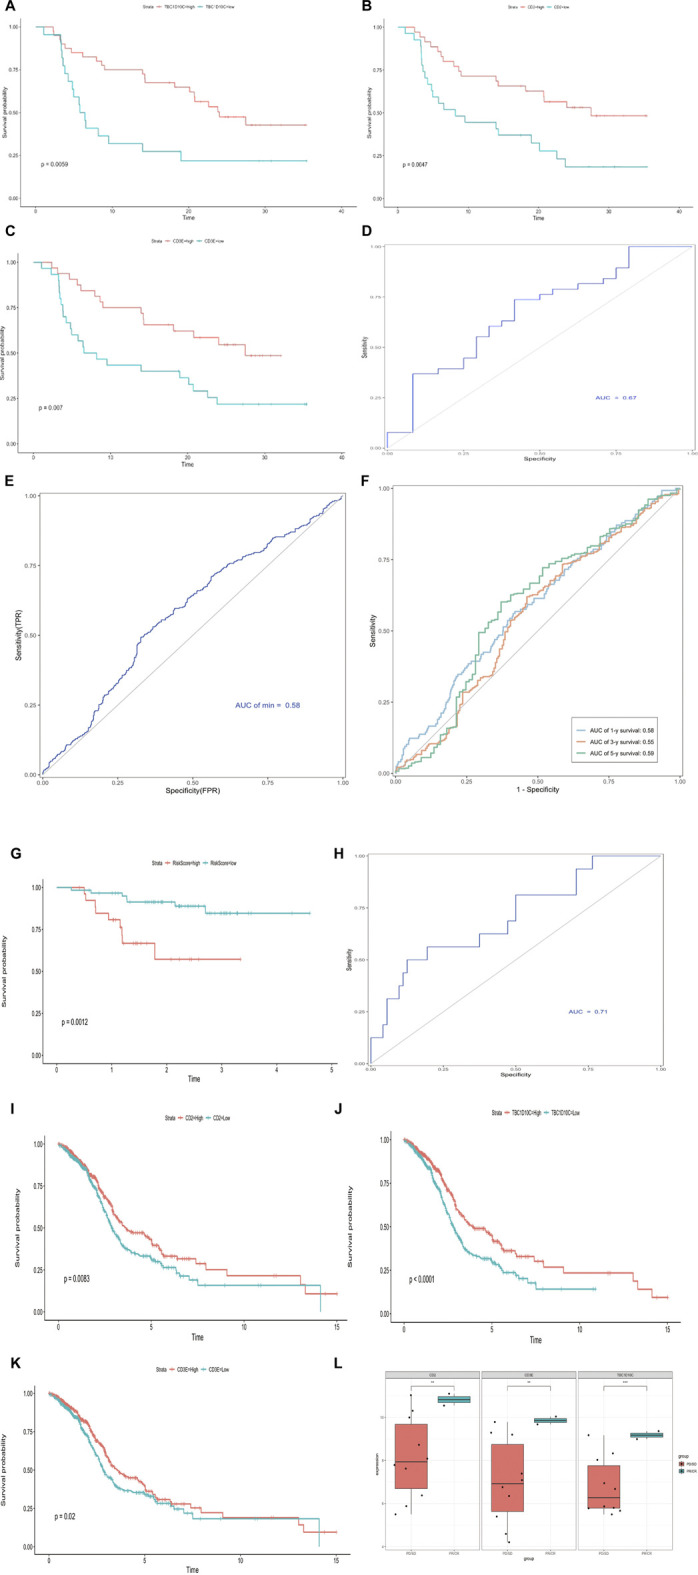
FIGURE 6.

Construction and verification of IMS risk prediction model. (A) Hundred‐time cross‐validation for tuning parameter selection in the LASSO model; combined cohort. (B) Risk score range in two groups (0 = alive, 1 = dead); combined cohort. (C) Kaplan–Meier curve shows high-risk and low-risk groups based on the risk score; combined cohort; log rank p < 0.0001; unit of time (years). (D) Kaplan–Meier curve shows high-risk and low-risk groups based on the risk score; TCGA cohort; log rank p = 0.00054, unit of time (years). (E) Receiver operating characteristic curve in combined cohort; AUC = 0.58. (F) Time–ROC curve in combined cohort; AUC 1 year = 0.58; AUC 3 years = 0.55; AUC 5 years = 0.59. (G) Kaplan–Meier curve shows high-risk and low-risk groups based on the risk score; external GSE102349 cohort; log rank p = 0.0012; unit of time (years). (H) Receiver operating characteristic curve in GSE102349 cohort; AUC = 0.71. (I–K) Kaplan–Meier curve shows high-risk and low-risk groups based on CD2, TBC1D10C, and CD3E expression, respectively; combined cohort CD2 log rank p = 0.0083; TBC1D10C log rank p < 0.0001; CD3E log rank p = 0.02; unit of time (years). (L) CD2, TBC1D10C, and CD3E expression in immunotherapy cohort, complete response (CR), partial response (PR), stable disease (SD), progressive disease (PD) as per RECIST criteria; asterisks represent different p values (* <0.05; ** <0.01; *** <0.001, **** <0.0001).
