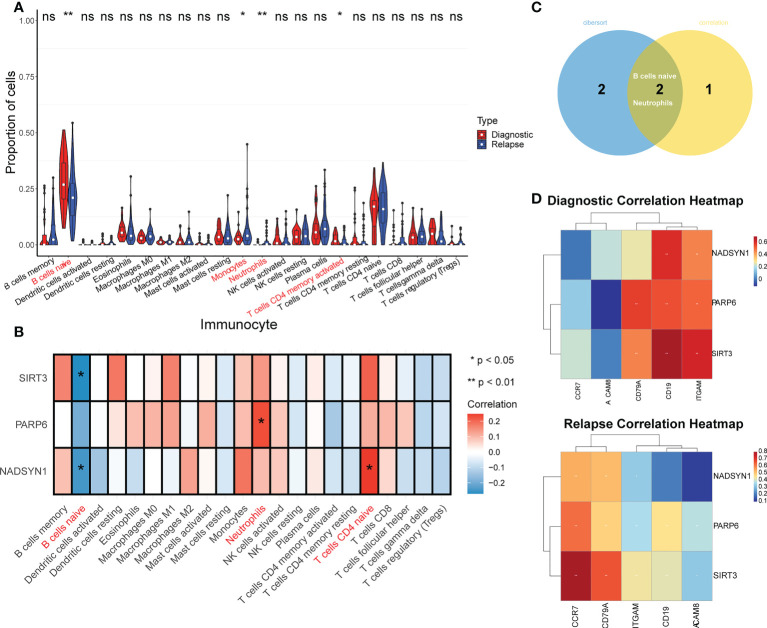
Figure 3.
TME analysis in GSE3912. (A) Immune infiltration differences between initially diagnosed and relapse groups (p < 0.05). * represents p < 0.05, ** represents p < 0.01, ns represents no significance. (B) The correlation analysis of immune cells and NADSYN1, PARP6, SIRT3. (C) A Venn-diagram of the differentially expressed immune cells (DEIs) and significantly biomarkers-related immune cells to obtain key DEIs. (D) The correlation heatmaps of biomarkers and corresponding gene markers of key DEIs in initially diagnosed and relapse samples.

