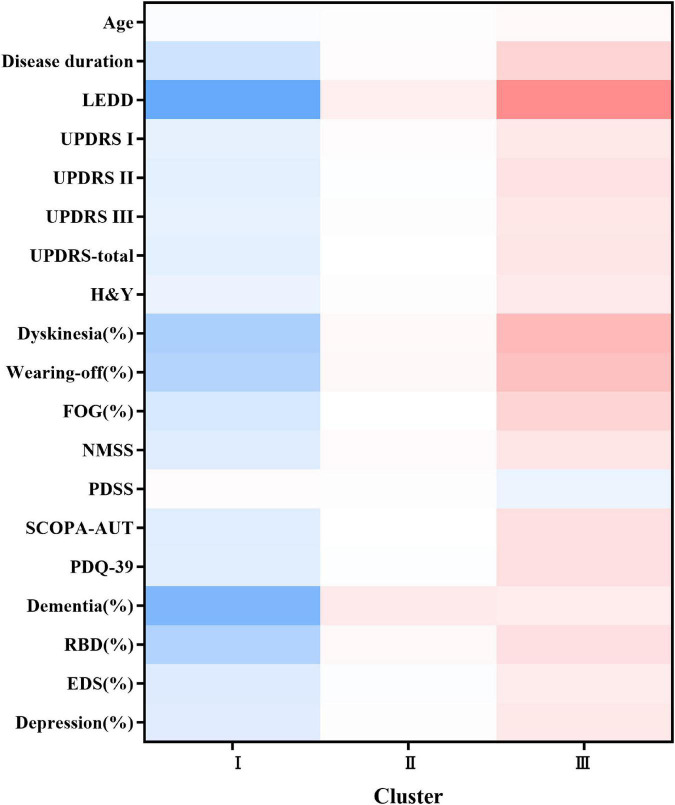
FIGURE 1.
Heatmap of the three subtypes at baseline. The figure was depicted according to the mean values or percentages of subtypes. The red color represented a more severe deficit and the blue color referred to a less severe symptom. The darker the figure described, the larger difference were shown among the subtypes. Variables with P value <0.05 are shown. LEDD, Levodopa Equivalent Daily Dose; UPDRS, Unified Parkinson’s disease Rating Scale; H&Y, Hoehn and Yahr; FOG, freezing of gait; NMSS, Non-Motor Symptoms Scale; PDSS, Parkinson’s Disease Sleep Scale; SCOPA-AUT, the Scale for Outcomes in Parkinson’s Disease for Autonomic Dysfunction; PDQ-39, Parkinson’s disease questionnaire-39 item version; RBD, Rapid Eye Movement Sleep Behavior Disorder; EDS, excessive daytime sleepiness.

