Figure 1.
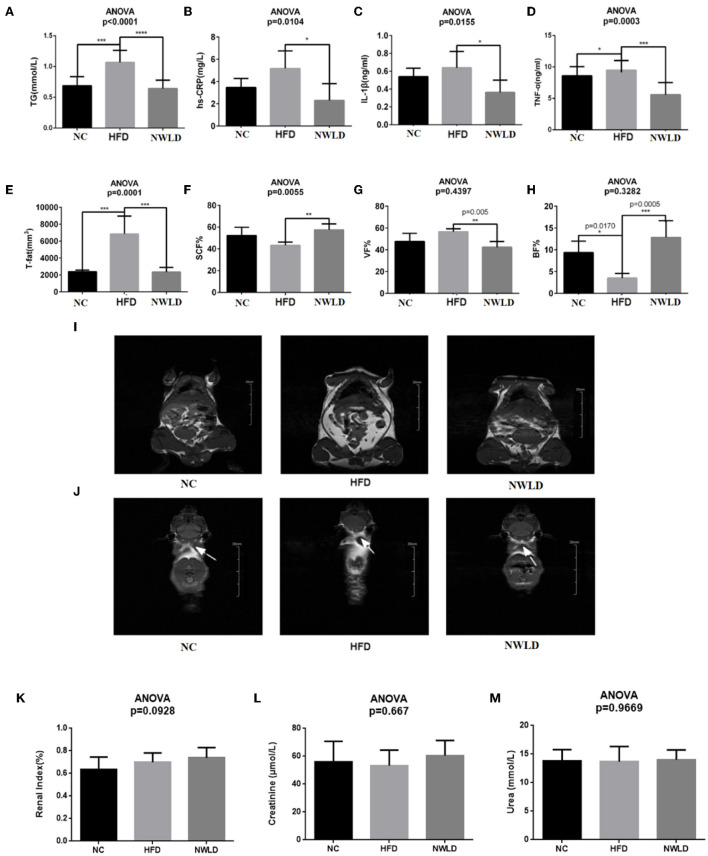
Comparison of phenotypic factors among groups. Bar charts of (A) serum triglycerides (TG), (B) hs-CRP, (C) IL-1β, (D) TNF-α, (E) total fat, (F) subcutaneous fat percentages, (G) visceral fat percentages, (H) brown fat percentages, and (I) white fat (the highlighted areas in the abdomen and subcutaneous tissue) in each group (coronal plane). Images were taken from NC4 section 7, HFD3 section 9, and NWLD3 section 6. (J) Brown fat of mice in different groups (butterfly areas are indicated by arrows). Images were taken from NC2 section 8, HFD5 section 29, and NWLD4 section 29. *p < 0.05; **p < 0.01; ***p < 0.001; ****p < 0.0001. Bar charts of (K) renal index, (L) serum creatinine, (M) serum urea.

