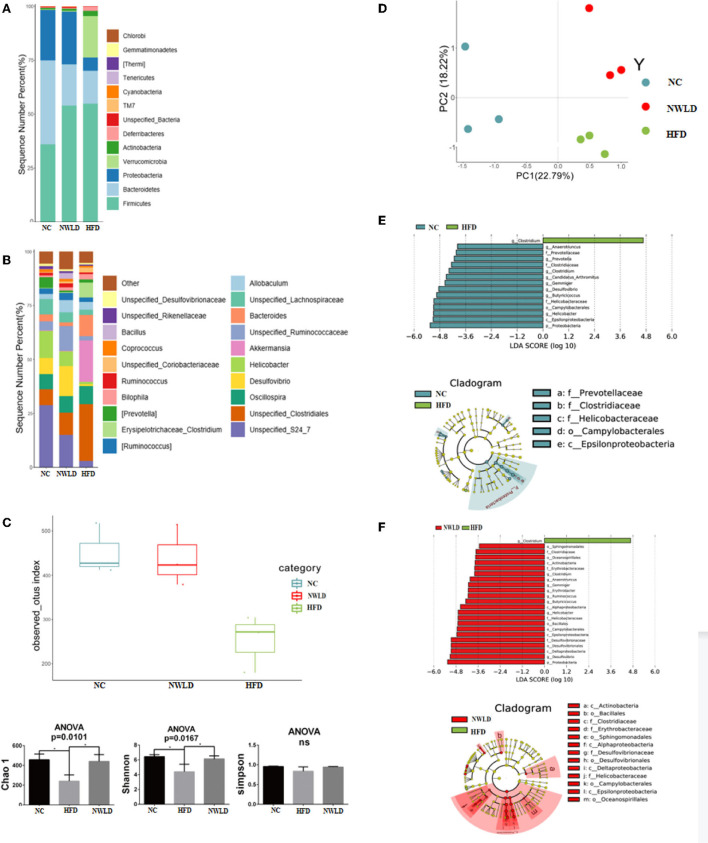
Figure 2.
Characteristics of the gut microbiota in different groups. (A) Histograms of the relative distribution of groups at the phylum level (top 20 species in relative abundance); (B) histograms of the relative distribution of groups at the genus level (top 20 species in relative abundance); (C) alpha diversity. Box plots of observed OTUs, histogram of Chao1, Shannon, and Simpson indices. ANOVA, *p < 0.05; ns, no significance. (D) Beta diversity; (E) LEfSe analysis LDA histograms (LDA score >2.0) and cladogram of characteristic microorganisms (the NC group compared to group HFD). Kruskal–Wallis test, *p < 0.05. LDA, each transverse column represents a species; the length of the column represents the LDA score, where a higher LDA score indicates a greater difference. The color of the bar indicates the species group. Layers from the inside to outside of the cladogram correspond to different classification levels, i.e., kingdom, phylum, class, order, family, and genus, and the lines between levels represent relationships. Each circular node represents a species. Yellow nodes indicate no significant difference between groups; non-yellow nodes indicate that the species is a characteristic microorganism of the corresponding group (with significantly higher abundance in this group). The shaded fans mark the subclassification interval of the characteristic microorganism. (F) LEfSe analysis LDA histograms (LDA score >2.0) and cladogram of characteristic microorganisms (group NWLD compared to group HFD). Kruskal–Wallis test, *p < 0.05.

