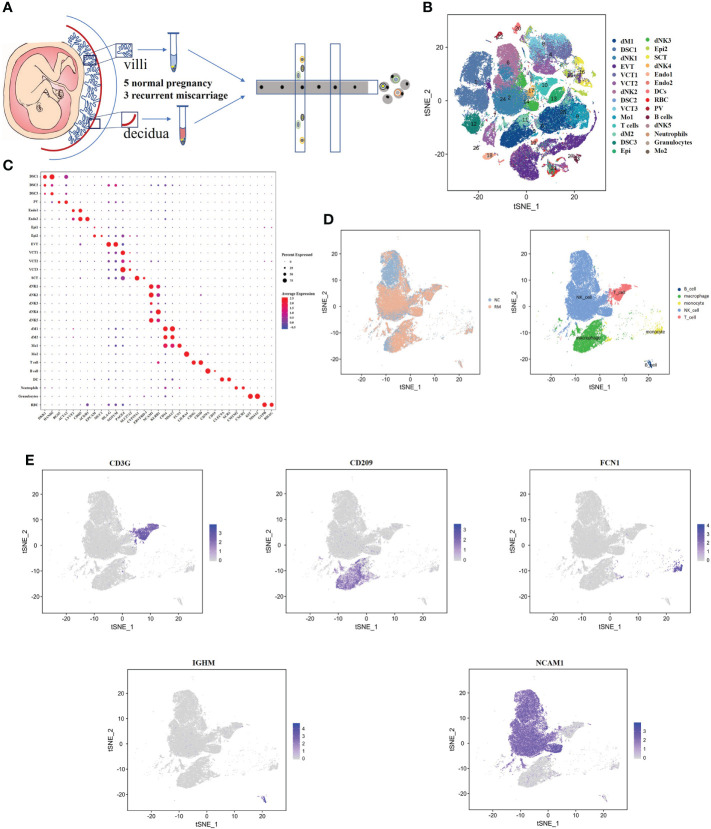
Figure 1.
Single-cell RNA-sequencing analysis identifies maternal fetal interface marker genes (A) Flowchart depicting the overall design of the single-cell RNA-sequencing analysis. (B) t-SNE plot of 112528 cells from five normal samples and three RM samples. dM, decidual macrophages; dNK, decidual NK cells; DSC, decidual stromal cells; EVT, extravillous trophoblast; VCT, villous cytotrophoblast; Mo, Monocytes; Endo, endothelial cells; SCT, syncytiotrophoblast; DC, dendritic cells; RBC, red blood cells; PV, perivascular cells; Epi, epithelial glandular cells; F, fibroblasts. (C) Dotplot map showing the expression of classical cell type‐specific marker genes in each cluster. (D) t-SNE plot of the five main immune cell types. (E) t-SNE plot showing the expression of the marker genes of the five cell types noted above.

