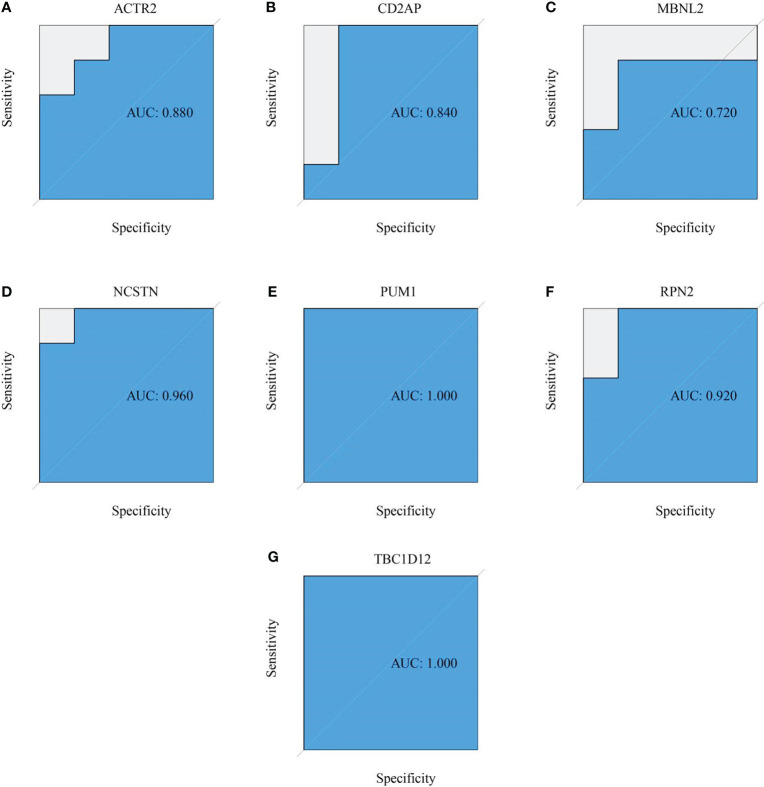
Figure 5.
External verification of the RM predictive value of the target genes. (A–G) ROC curves estimating the diagnostic performance of the target genes (A) ACTR2, (B) CD2AP, (C) MBNL2, (D) NCSTN, (E) PUM1, (F) RPN2 and (G) TBC1D12 in the prediction of a RM in the GSE26787 datasets.

