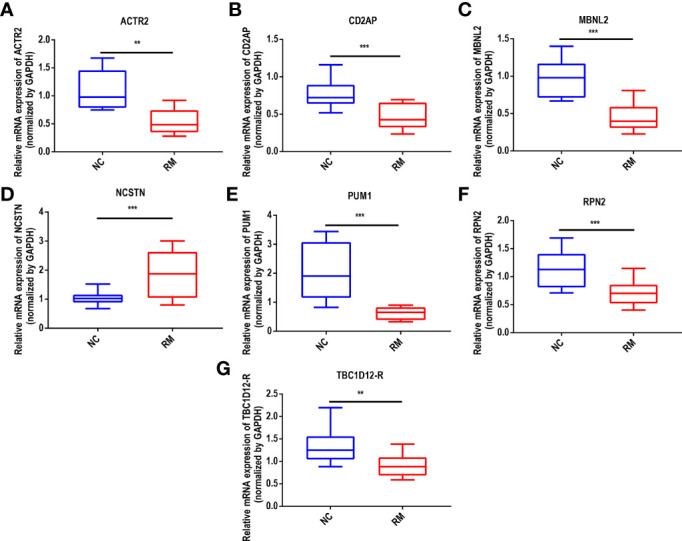
Figure 6.

Expression validation of ACTR2 between normal and RM tissues. (A) ACTR2, (B) CD2AP, (C) MBNL2, (D) NCSTN, (E) PUM1, (F) RPN2 and (G) TBC1D12, "**p < 0.01, ***p < 0.001.

Expression validation of ACTR2 between normal and RM tissues. (A) ACTR2, (B) CD2AP, (C) MBNL2, (D) NCSTN, (E) PUM1, (F) RPN2 and (G) TBC1D12, "**p < 0.01, ***p < 0.001.