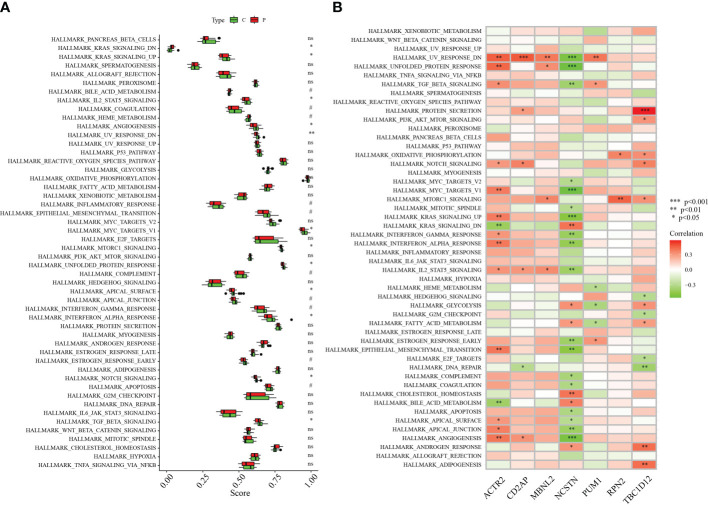
Figure 7.
Correlation between hub genes and the 50 HALLMARK signaling pathways. (A) Comparison of the 50 HALLMARK signaling pathways between the RA group and healthy controls. (B) Correlation between the target genes and the 50 HALLMARK signaling pathways. *p < 0.05, **p < 0.01, ***p < 0.001 0.05. 0.05 < p < 0.2. NS, no significance.

