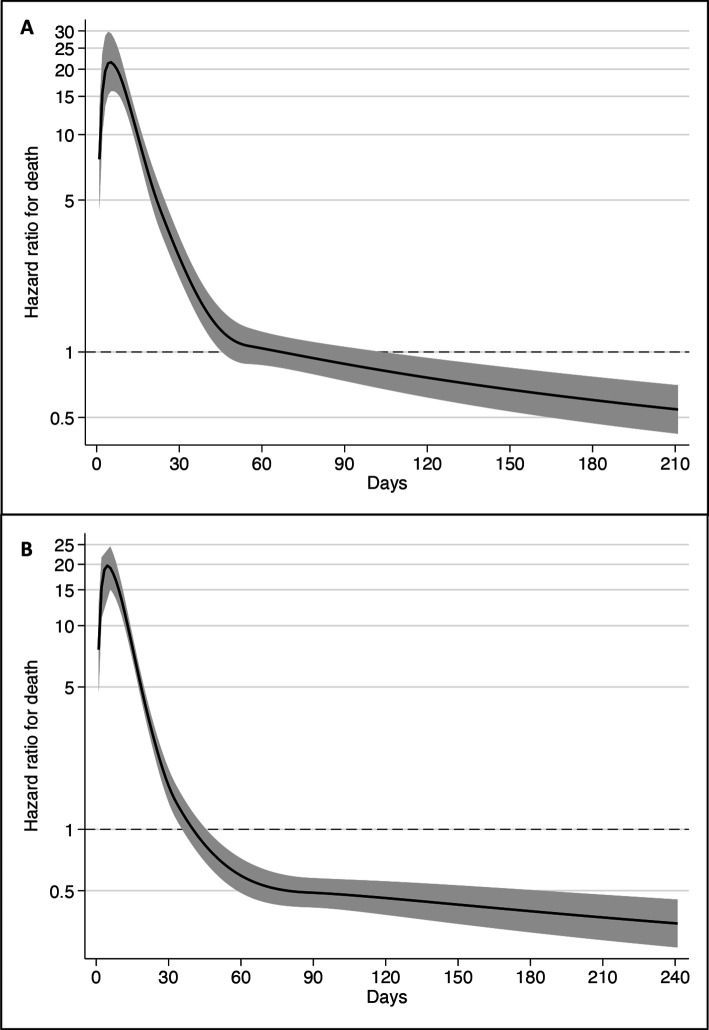
Figure 2.
HR for death over time in residents with SARS-CoV-2, as compared with controls in (A) the main analysis and (B) in the secondary analysis. Estimates were obtained using flexible parametric models with restricted cubic splines (four knots in default positions). The shaded areas show the 95% CI.

