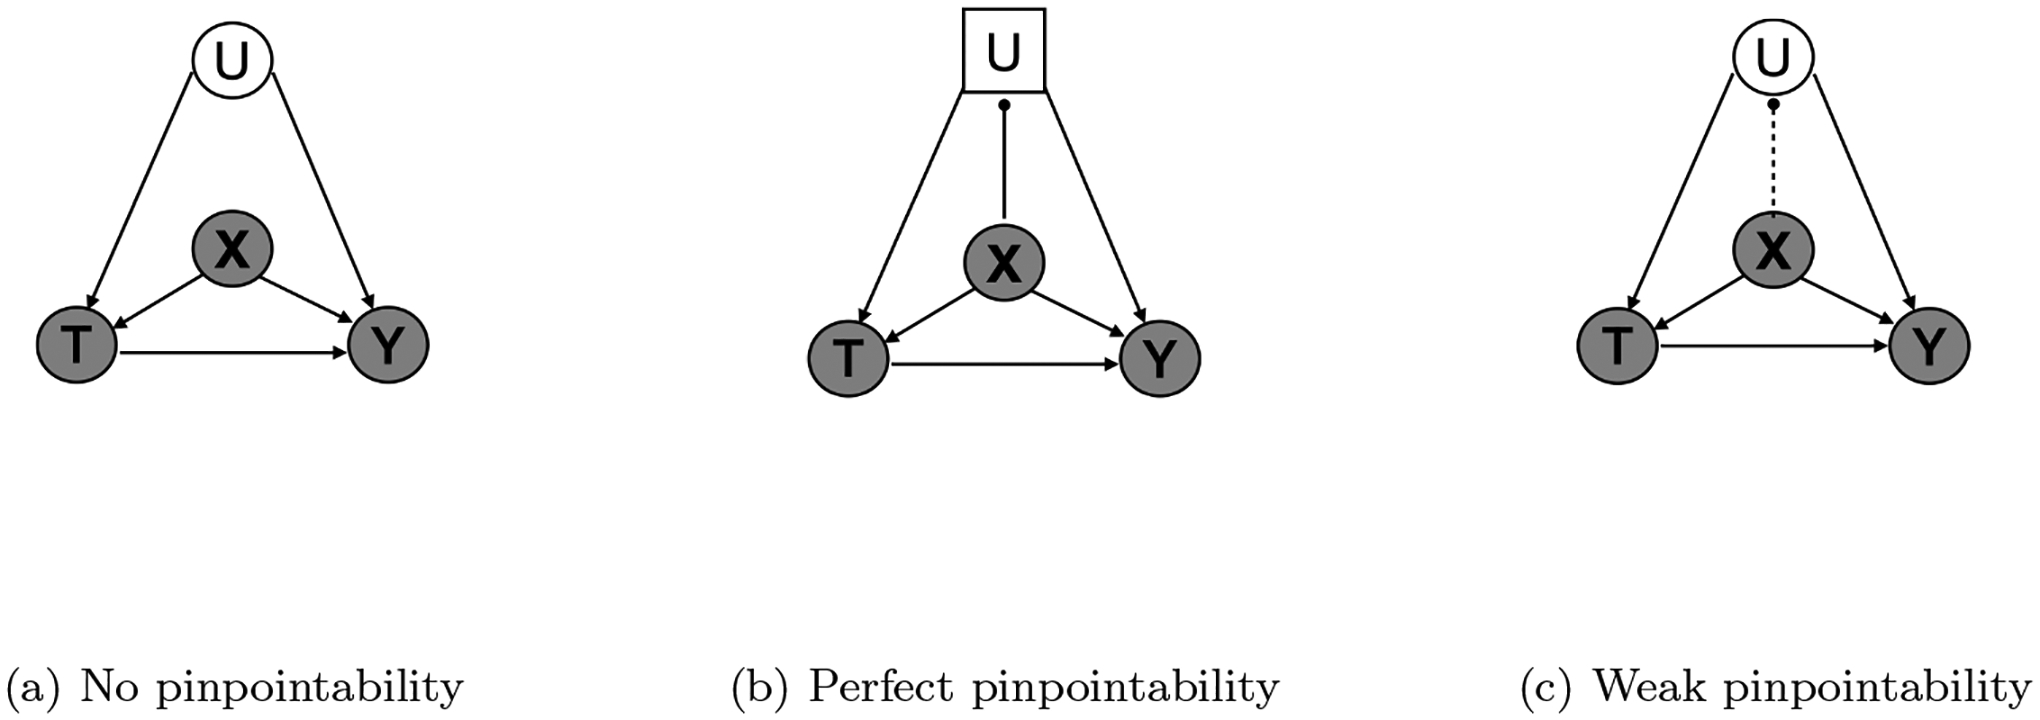
Figure 1:

Causal graphs to estimate the treatment effect of T on the outcome Y. (a) Causal graph under no pinpointability. The unmeasured confounder U is not pinpointed by X. (b) Causal graph under perfect pinpointability. The unmeasured confounder U is a deterministic function of the measured covariates X. (c) Causal graph under weak pinpointability. The unmeasured confounder is only partially pinpointed by X. Random variables are represented with circles, deterministic variables are represented with squares, measured variables are shaded, indirectly measured or unmeasured are not shaded, strong pinpointing is presented with a solid line, and weak pinpointing is presented with a dash line.
