
Figure 2:
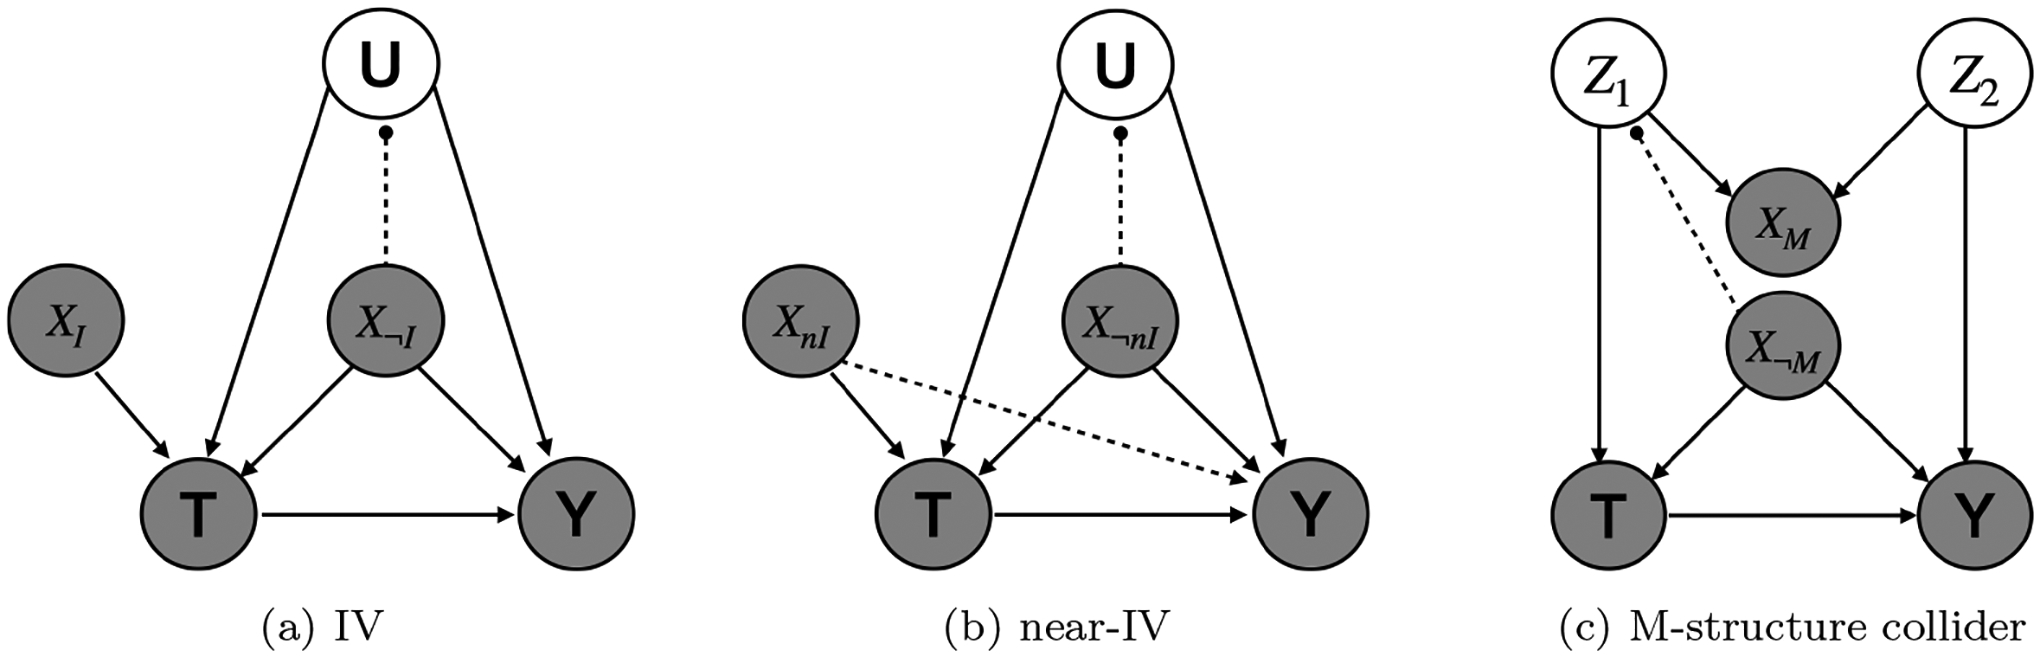
Causal graph of a) instrumental variable, b) near-instrumental variable and c) M-structure collider. The dashed line with a solid dot means that the variable by the solid dot can be pinpointed by the measured covariates. We use different subscripts to distinguish the measured covariates playing different roles in the causal graph.