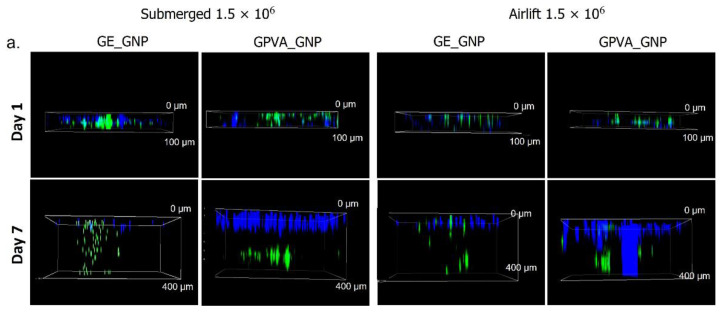
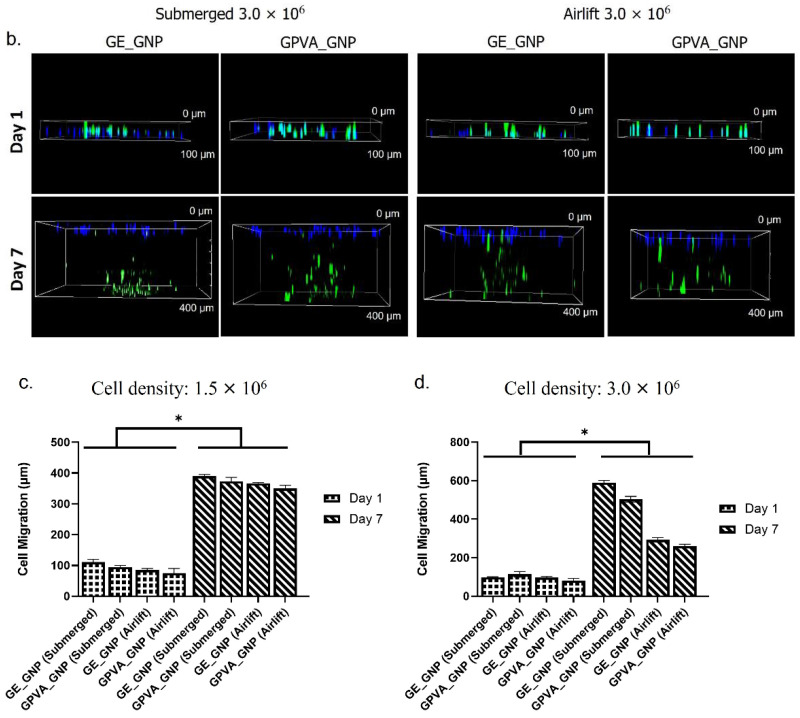
Figure 4.
(a) 3D Confocal imaging of cell migration for 1.5 × 10⁶ of cell density from day 1 until day 7. (b) 3D Confocal imaging of cell migration for 3.0 × 10⁶ of cell density from day 1 until day 7. (c) Cell migration rate for 1.5 × 10⁶ of cell density from day 1 until day 7. (d) Cell migration rate for 3.0 × 10⁶ of cell density from day 1 until day 7. * indicates p < 0.05.


