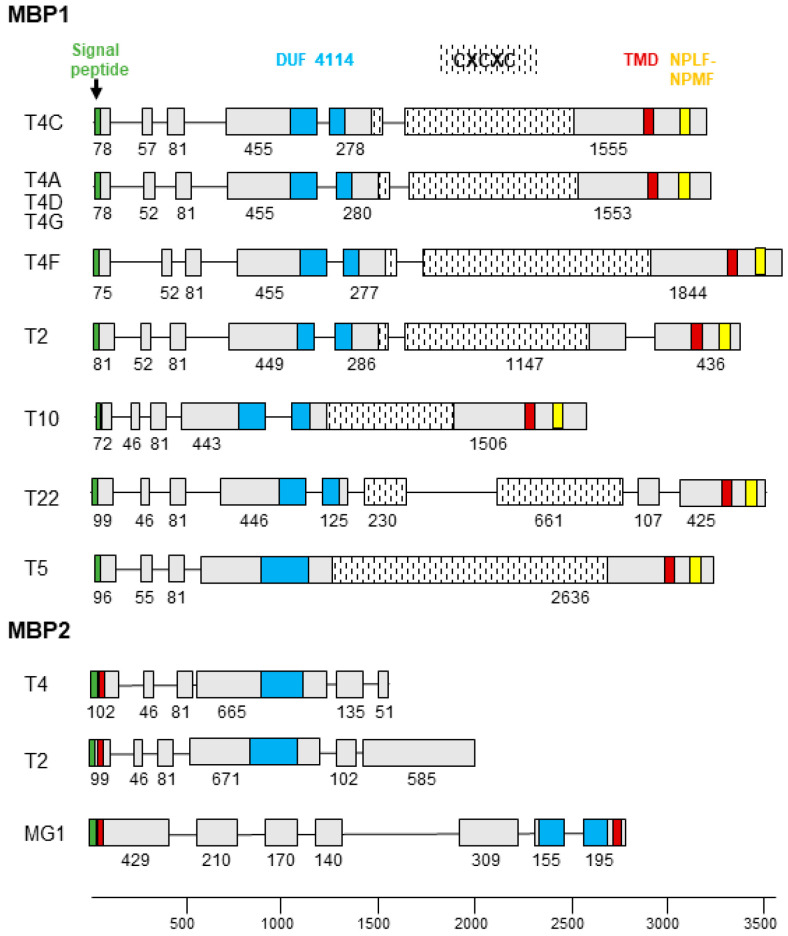
Figure 3.
MBP gene structure. Schematic drawing of the exon/intron structure of the MBP1 and MBP2 genes of Acanthamoeba. Exons are shown as boxes with the number of nucleotides below, introns as a line. The signal peptide, DUF 4114, CXCXC repeat coding region, transmembrane domain (TMD), and cell signalling NPLF motif are colour coded and shown at the top.

