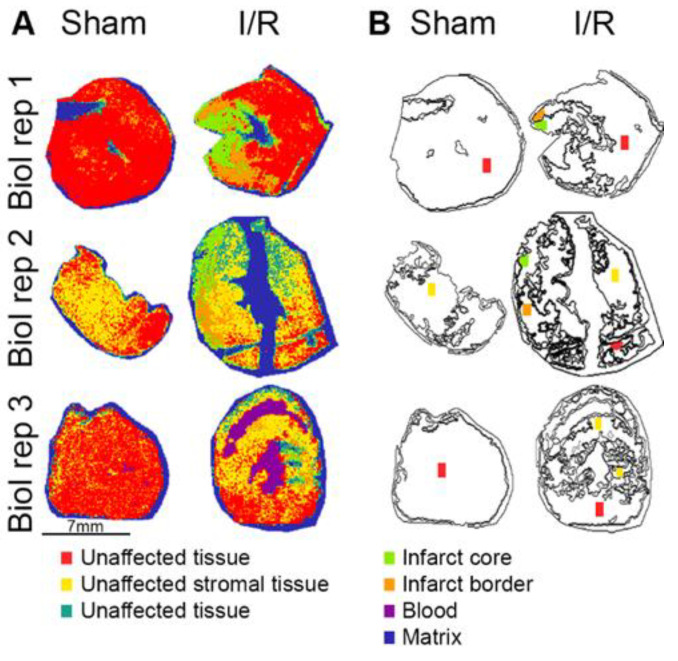
Figure 3.
Segmentation analysis of sham and I/R hearts divided the tissue over seven clusters, separating infarct, unaffected tissue, blood and matrix. (A) The segmentation results showed a representation of the infarct core by the green and infarct border by orange clusters, while the red, yellow and turquoise clusters corresponded to unaffected tissue. Blood and matrix were represented by the purple and blue clusters, respectively. (B) Based on the segmentation results different ROIs were selected for proteomic analysis. The colored regions (approximately 0.5 mm2) were ablated using LMD. Biol rep = biological replicate.

