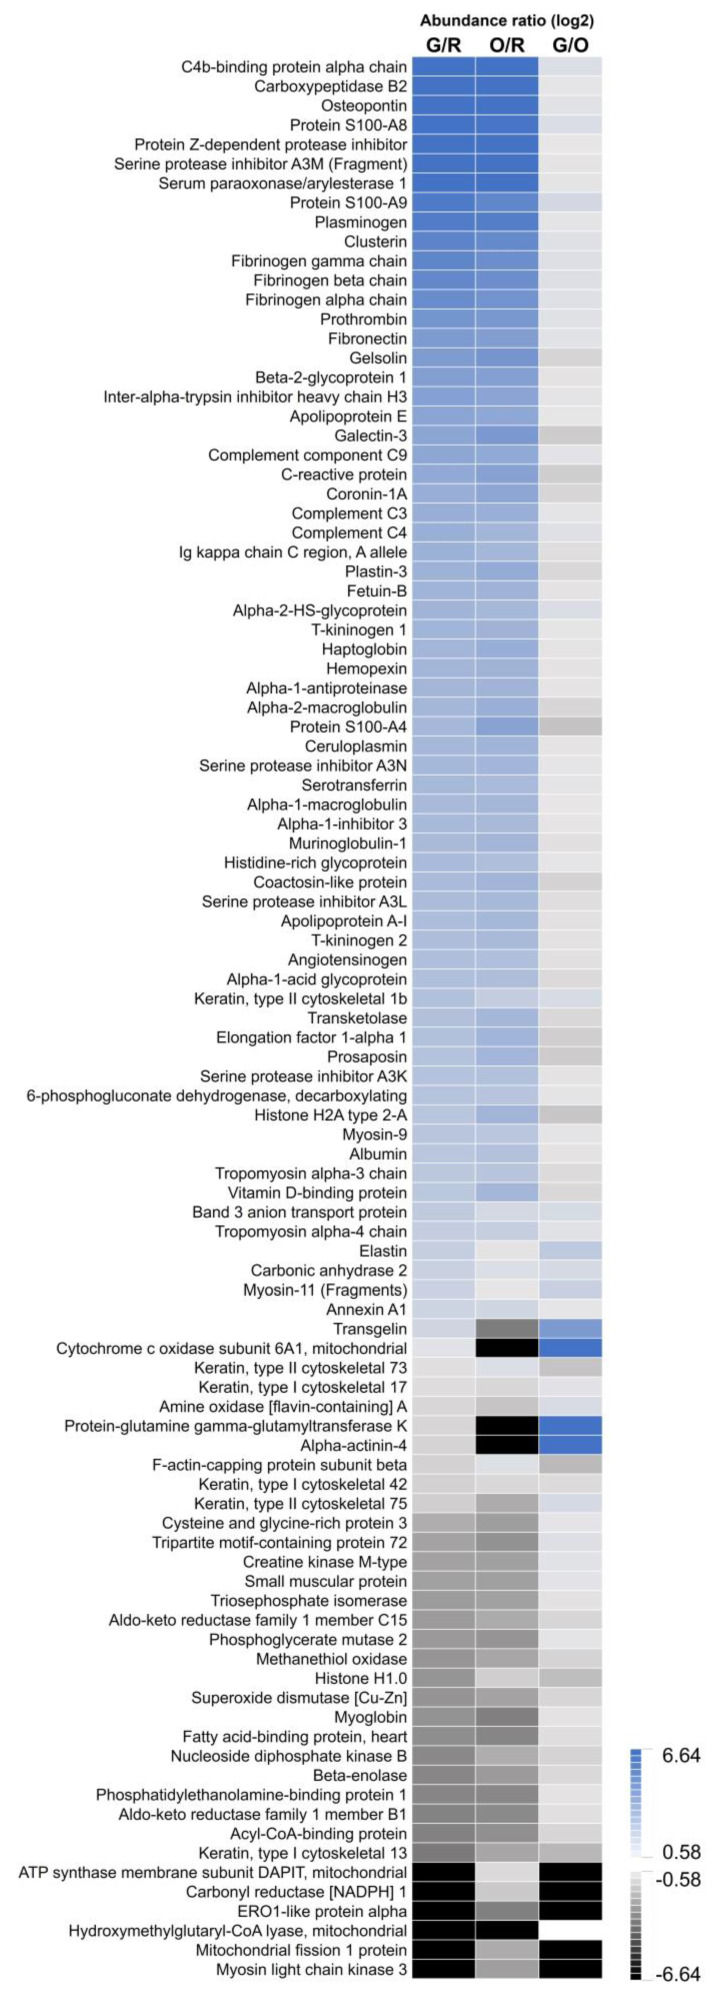
Figure 5.
Heatmap showing the abundance ratios for the differential proteins (n = 99). In blue the upregulated proteins (log2 ratio ≥ 0.58), the downregulated proteins (log2 ratio ≤ −0.58) in black. R = Red; Unaffected tissue, O = Orange; Infarct border, G = Green; Infarct core. G/R is the ratio of Green versus Red, O/R is the ratio of Orange versus Red, G/O is the ratio of Green versus Orange.

