Figure 5.
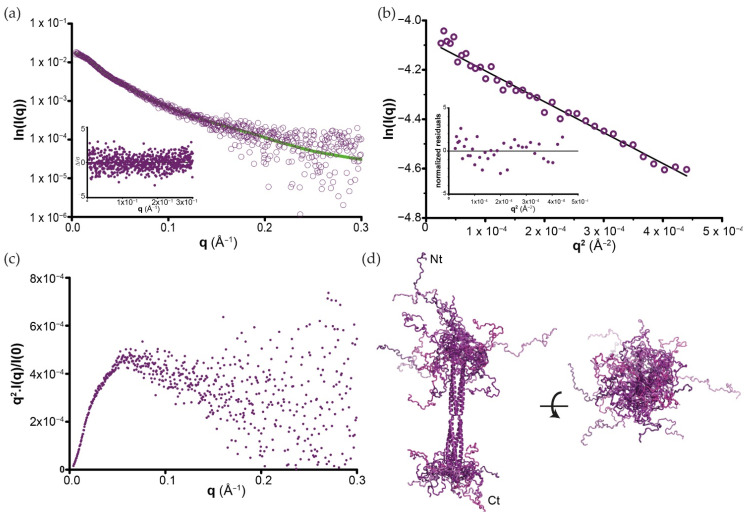
Flexibility analysis of BoDV-1 full-length P. (a) Experimental SAXS diffusion curve (deep-purple circles) of PFULL overlaid with the averaged SAXS curves (green) calculated from the EOM ensemble shown in panel (d). (b) Guinier extrapolation for the determination of the Rg. The smallest plot corresponds to the normalised residual. (c) Kratky plot showing the partially unfolded propensity of PFULL samples. (d) Conformational ensemble (6 of 10,000 conformers are shown; these models are perfectly representative of the whole population (Figure S6)) of PFULL obtained from the modelling procedure based on EOM. POD X-ray structure is coloured deep purple, whereas the N- and C-terminal intrinsically disordered regions are coloured with six different shades of purples.

