Figure 6.
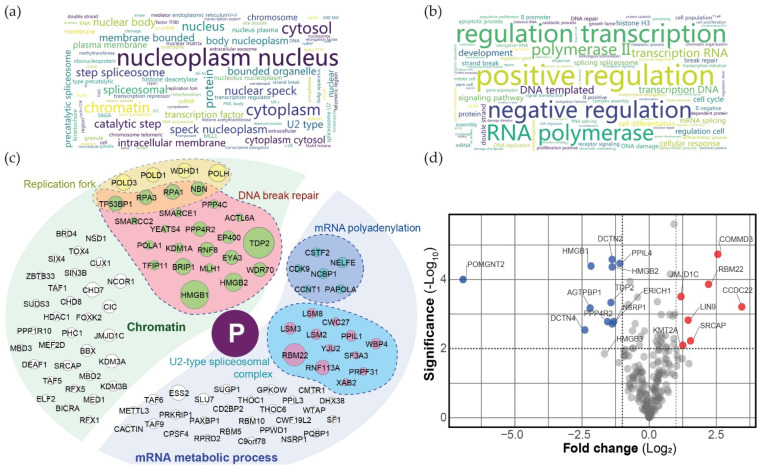
Proximal interactomes of PFULL in human cells. Word clouds of Gene Ontology enrichment analysis (https://toppgene.cchmc.org/; accessed on 1 September 2022) of Cellular Component (a) and Biological Process (b) (assembled on http://www.bioinformatics.com.cn/plot_basic_wordcloud_118_en; accessed on 1 September 2022). (c) Illustration of a subset of PFULL high-confidence interactors. Proteins are grouped and coloured by selected functions or compartments, as indicated on the diagram; node diameter is proportional to the Log2 fold change against control. (d) Volcano plot comparing the N- and C-terminal BirA* tagged BioID data. Blue and red dots represent N- and C-terminal BirA* tagged preferential partners, respectively (p-value < 0.01 and Log2 fold change > 1 between both fusions). Assembled using https://huygens.science.uva.nl/VolcaNoseR/; accessed on 1 September 2022). All data are based on three biological replicates and have been filtered for background against a set of 20 control runs (see Methods and Supplemental Methods for details).

