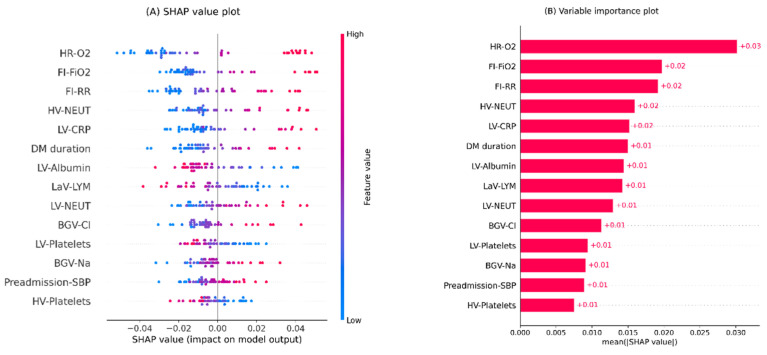
Figure 4.
Global interpretation plots for the updated inpatient COVID-19 mortality prediction model. (A) Bee swarm SHAP values plot, (B) SHAP summary importance plot. The bee swarm plot shows all SHAP values in accord with predictors values. The summary plot presents predictors in descending order based on their overall importance on the model’s outcomes derived from mean absolute SHAP values. Note. BGV: blood gas value; Cl: chloride; CRP: c-reactive protein; DM: diabetes mellitus; FI: first inpatient; FiO2: fraction of inspired oxygen; HR: highest requirement; HV: highest value; LaV: last value; LV: lowest value; LYM: lymphocytes; Na: sodium; NEUT: neutrophils; O2: oxygen; RR: respiratory rate; SBP: systolic blood pressure; SHAP: SHapley Additive exPlanations.

