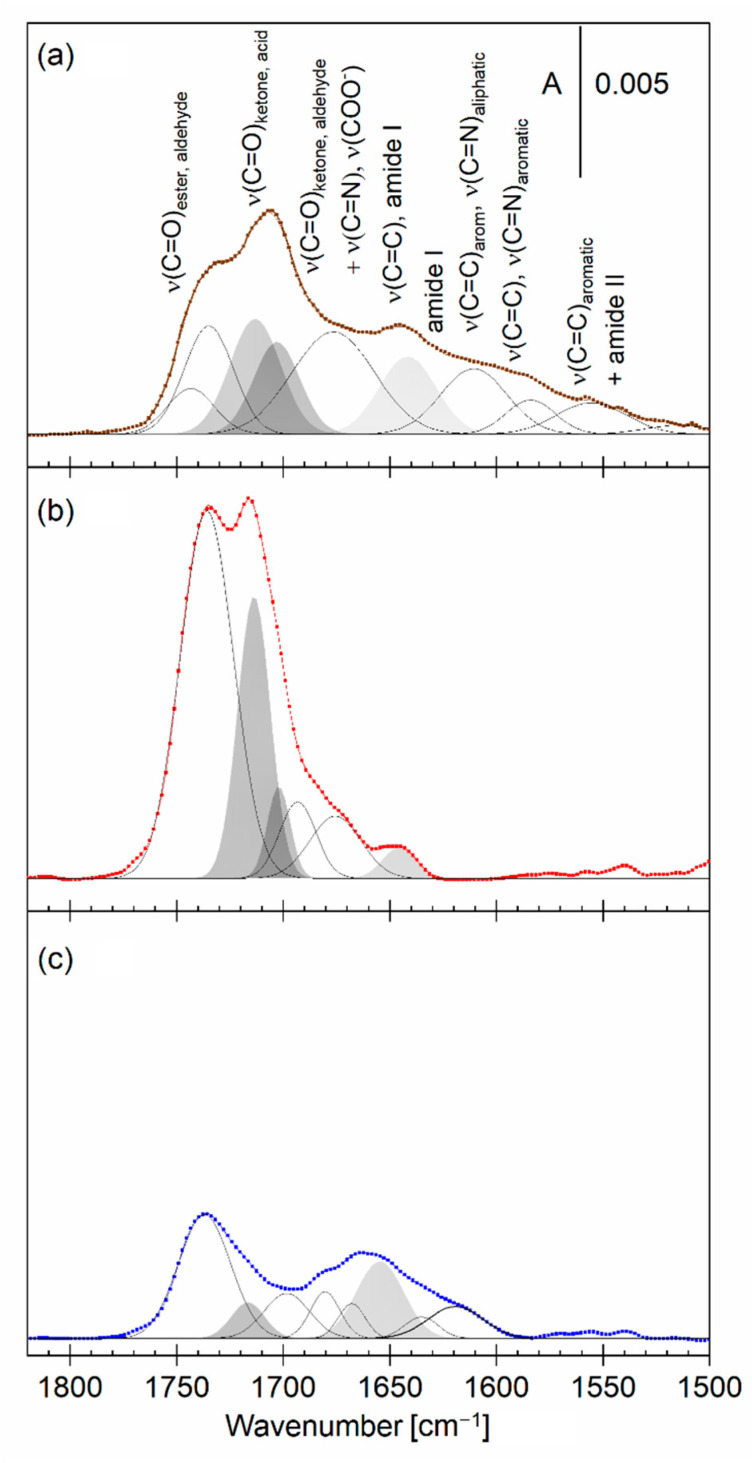
Figure 5.
(a) Deconvoluted ATR IR spectrum (brown line) of a dried extract from Piptoporus betulinus with assignment of the deconvoluted bands and (b,c) deconvoluted PM IRRA spectra (red and blue lines) of the asymmetric DMPC:chol—DMPC:GD1a:chol bilayer on the Au surface transferred from (b) 1% vol Piptoporus betulinus extract in the aqueous subphase (red) and (c) aqueous (blue) subphase in the 1820–1500 cm−1 spectral region. A — absorbance.

