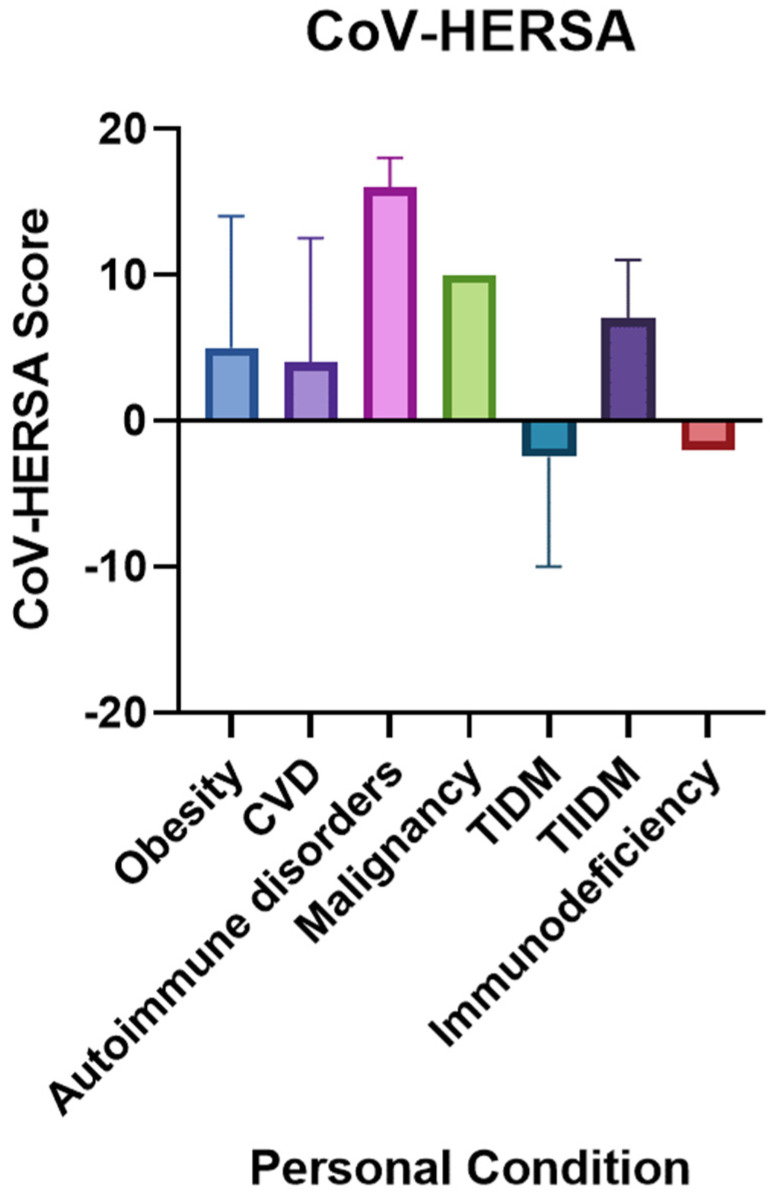
Figure 2.
CoV-HERSA scores comparison based on the participants’ comorbidities. The bar chart demonstrates the CoV-HERSA according to the conditions they suffer from, which are obesity (Blue), CVD (Purple), autoimmune disorders (Pink), malignancy (Green), TIDM (Navy blue), TIIDM (Dark Purple) or immunodeficiency (Red). Bar charts demonstrate median values and interquartile ranges where applicable. Kruskal-Wallis test with Dunn’s correction was used. CVD: Cardiovascular diseases; TIDM: Type 1 Diabetes Mellitus; TIIDM: Type 2 Diabetes Mellitus.

