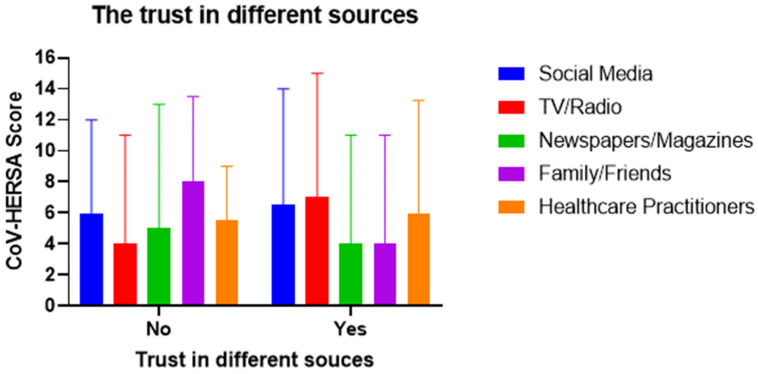
Figure 5.
Participants’ CoV-HERSA scores are based on their trust in the different sources of information. The bar chart demonstrates the different CoV-HERSA scores of participants based on whether or not they use the different sources of information. These sources are social media (Blue), TV/radio (Red), Newspapers/magazines (Green), family/friends (Purple), and Healthcare practitioners (Orange). The bar chart demonstrates median scores with interquartile ranges. Two-way ANOVA followed by Tukey correction for multiple comparisons were used.

