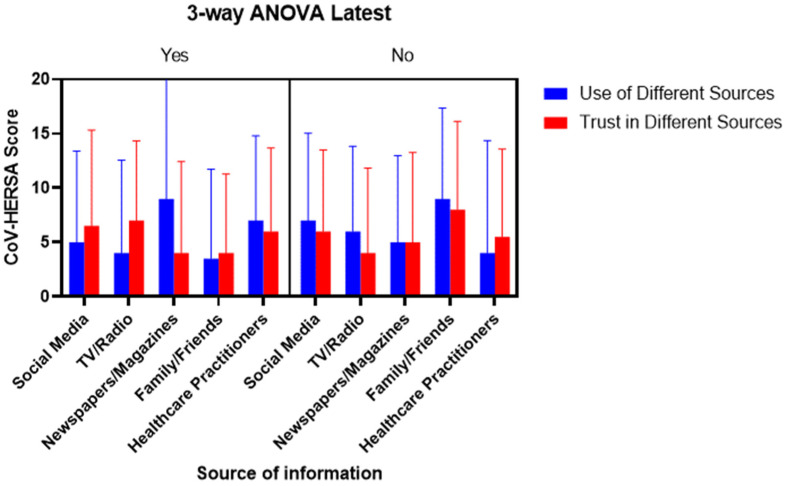
Figure 6.
The comparison of CoV-HERSA scores is based on the participants’ use and trust in the different sources of information. The figure is divided into the main section, depending on participants’ use/trust in the different sources of information (Yes) or the lack of them (No). This is followed by comparing bar charts based on participants’ use (Blue) or trust (Red) in the different sources of information. Bar charts demonstrate median CoV-HERSA scores with interquartile ranges. Three-way ANOVA was used here.

