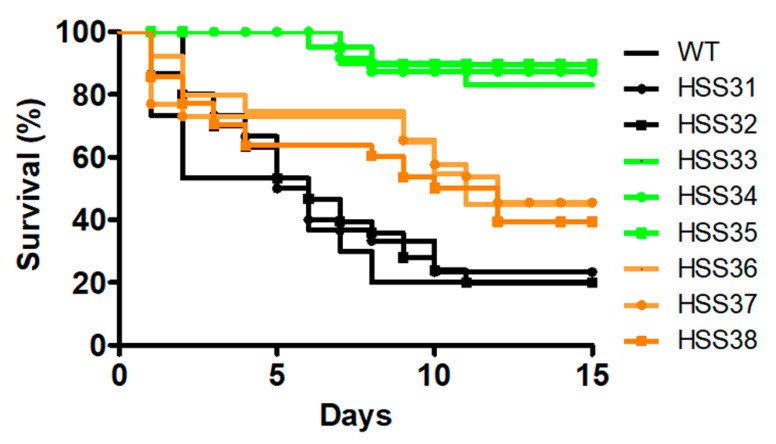
Figure 7.
Galleria mellonella killing curves by Sporothrix schenckii wild-type, control, and ROT2-silenced strains. Animal groups contained 30 larvae and were inoculated with 1 × 10⁵ yeast-like cells of the different strains, and survival was recorded daily for two weeks. Data are shown in Kaplan–Meier plots. The statistical analysis showed no differences among the WT, HSS31, and HSS32 strains (p = 0.57), among HSS33, HSS34, and HSS35 (p = 0.88), or among HSS36, HSS37, and HSS38 (p = 0.79). However, the two groups of silenced strains showed curves statistically different when compared between them or with the control group (in black lines; p < 0.05, for both cases).

