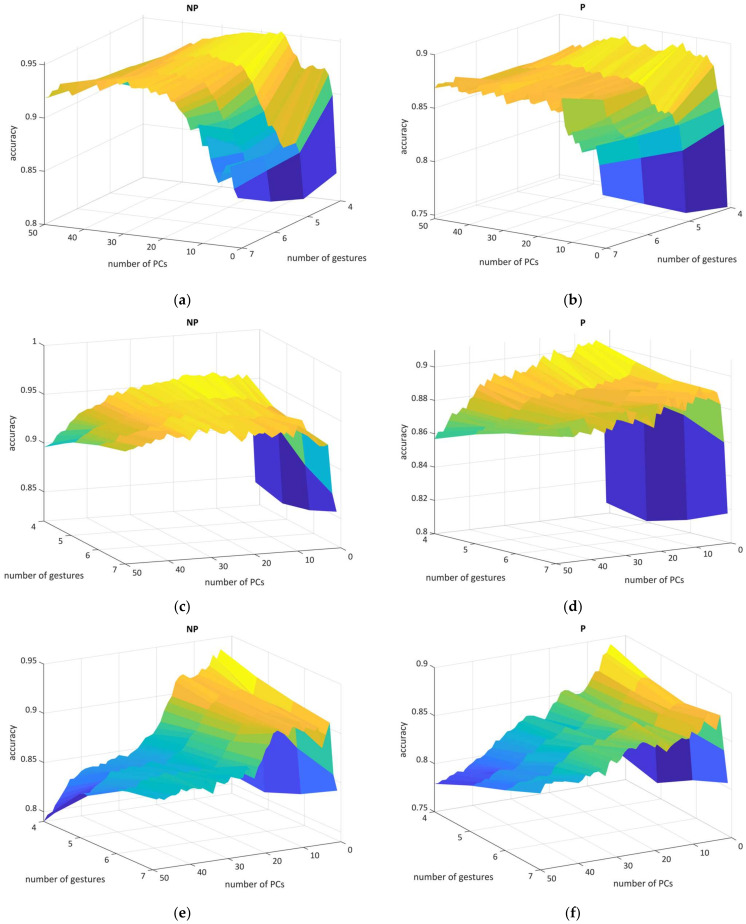
Figure 4.
The 3D mesh illustrates the relationship between GLs in paretic and non-paretic datasets (left figures obtained from NP19, right from P19), number of PCs, and accuracy: (a,b) SVM, (c,d) LDA, and (e,f) k-NN performance. The color heatmap mesh represents the accuracy result range from dark blue (lower scores) to yellow (higher scores).

