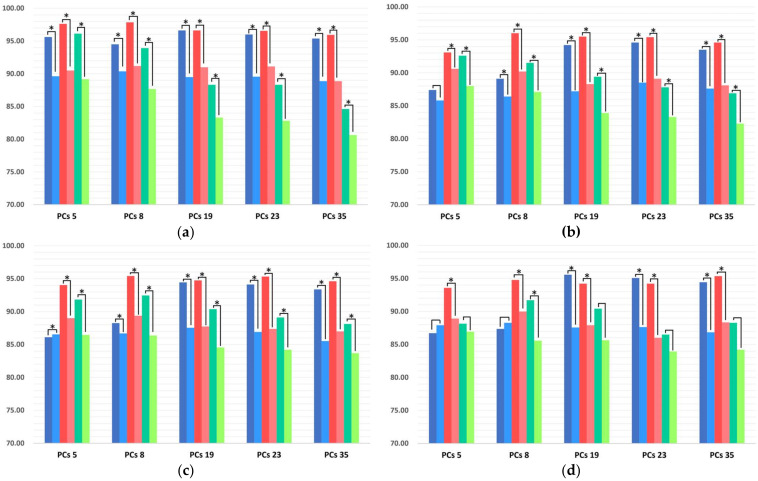
Figure 6.
Total mean accuracy rates of GLs from four to seven using SVM, LDA, and k-NN, dependent on the application of PCA (* p < 0.05) on paretic (P19) and non-paretic (NP19) datasets: PCA-dependent GL4 (a), GL5 (b), GL6 (c), and GL7 (d) model. Legend options: dark blue (NP19) and blue (P19) bars are the Acc from SVM, red (NP19) and pale-red (P19) bars are the Acc from LDA, dark-green (NP19) and green (P19) bars are the Acc from k-NN. Asterisks between the paretic and non-paretic evaluations of the single classifier indicate statistical significance (* p < 0.05).

