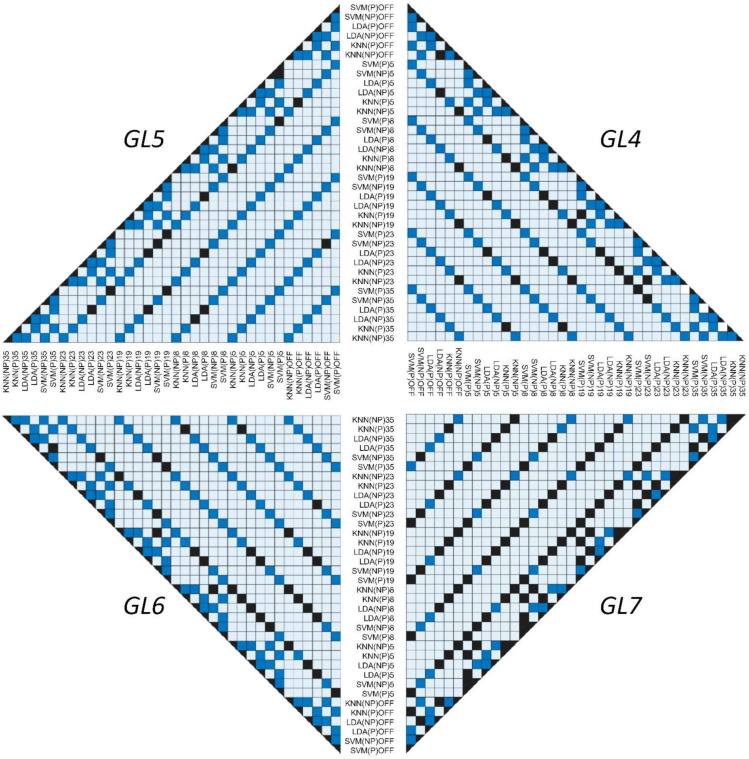
Figure 7.
Testing difference between classifiers (SVM, LDA, and k-NN) using a paired t-test among paretic and non-paretic sides with and without the use of PCA: right top is GL4, left top is GL5, left bottom is GL6, and right bottom is GL7 model. The dark-blue squares indicate a significance between the assessed pairs of classifiers (p < 0.05) and black color shows non-significance (p > 0.05).

