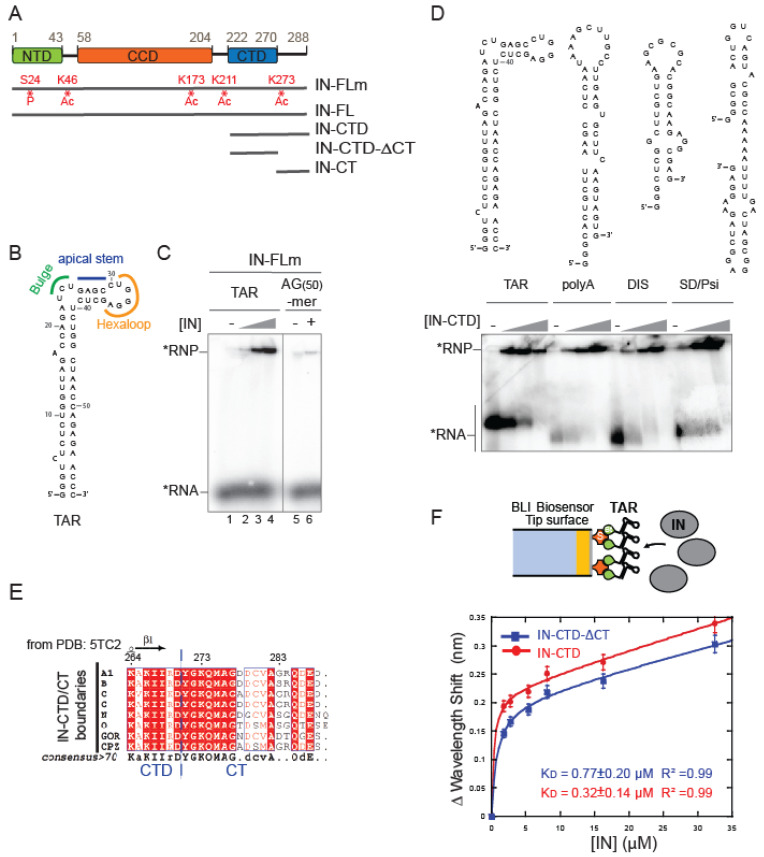
Figure 1.
IN binds to structured RNA. (A) Schematic diagram showing the domain organization of IN: the N-terminal domain (NTD), the catalytic core domain (CCD) and the C-terminal domain (CTD) are indicated respectively in green, orange and blue rectangles. Recombinant protein versions used in this study are represented by grey lines: IN full-length from mammalian expression system (IN-FLm); IN full-length from E. coli (IN-FL); IN-CTD (residues 222 to 288); IN-CTD-ΔCT (222 to 270); IN-CT (270 to 288). Sites of phosphorylation (P) and acetylation (Ac) are shown in red. (B) Structural model of TAR RNA obtained with RNA Fold WebServer [48,49] predicting a minimum free energy of −29.60 kcal/mol. (C) Representative native 6% polyacrylamide gel illustrating the Electrophoretic mobility shift assay (EMSA) showing the interaction of IN-FLm with TAR RNA or an unstructured RNA 50-mer (AG(50)-mer) labelled with 32P (black star). The RNA substrates (50 nM) were incubated with various concentrations of IN-FLm or without protein (TAR RNA: 0; 100, 200, 400 nM of IN-FLm; AG(50)-mer RNA: 0 or 400 nM of IN-FLm). (D) Models of secondary structures of four RNA elements belonging to 5′ untranslated region of the HIV-1 RNA genome: TAR, Poly-A, DIS and SD/Psi (upper panel). EMSA assay showing the binding of IN-CTD to these RNA elements (lower panel). Increasing amounts of IN-CTD (0; 100; 200; 400 nM) were incubated with 5′-end radiolabeled RNA (50 nM). (E) Sequence alignment of the C-terminal extremity of IN-CTD from HIV-1 subtypes and simian viruses. All amino acid sequences were obtained from the HIV database compendium (http://www.hiv.lanl.gov/, accessed on 28 October 2020) and aligned using Clustal Omega (https://www.ebi.ac.uk/Tools/msa/clustalo/, accessed on 28 October 2020) in order to have a consensus sequence for each viral subtype. Consensus sequences from subtypes A1, B, C, G, N, O and from GOR and CPZ, where aligned and analyzed by ESPript 3.0 Web server [50]. Secondary structure elements from IN-CTD- ΔCT structure (PDB code: 5TC2) are presented on top of the alignment (strands with arrows). Red shading indicates sequence identity and boxes indicate sequence similarity, according to physical-chemical properties. (F) top: Schematic representation of the Bio-Layer interferometry (BLI) experiment showing the binding of IN (grey ellipses) to 5′-biotinylated TAR RNA immobilized on streptavidin-coated biosensor; bottom: graph showing the wavelength shifts recorded at 200 s after the start of the protein/RNA binding were plotted against the corresponding IN-CTD-ΔCT (blue line, squares) and IN-CTD (red line, circles) concentrations, in order to calculate the respective equilibrium dissociation constant (KD) values. Data points were fitted to the equation: y = Bmax × x/(KD + x) + NS × x where Bmax is the maximum wavelength shift and NS the slope of the non-linear component as described in [51]. The coefficients of determination (R2) and equilibrium dissociation constant (KD) values obtained are indicated in the graph for each IN fragment. Binding assays were performed in duplicate. Error bars indicate the Standard Error of the Mean.

