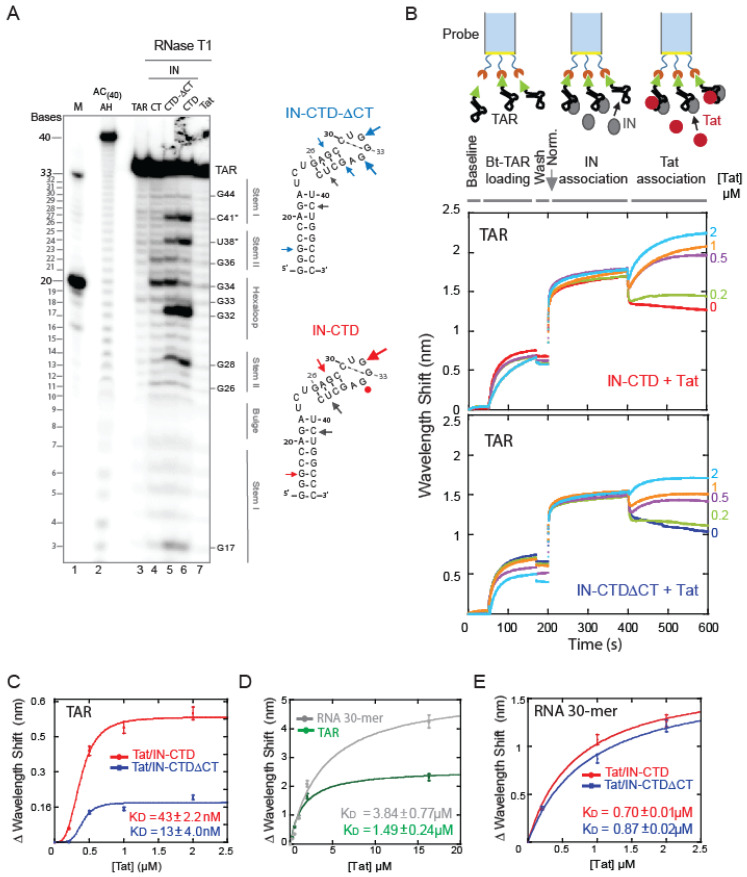
Figure 3.
IN induces structural modifications of TAR, promoting Tat binding. (A) Probing the change in the secondary structure of TAR RNA complexed with different fragments of IN and Tat. 5′-end radiolabeled TAR (34-mer) was incubated in the presence or absence of protein for 30 min at 37 °C prior to RNase T1 treatment, as described in experimental procedures. RNA fragments were separated on a 15% denaturing polyacrylamide sequencing gel. Bands corresponding to certain T1 cleavage (at G bases) products are identified as position markers. Probing gel lanes are as follows: (M) Ladder of two RNA transcripts of 33 and 20 nucleotides in length (lane 1); (AC(40) AH) alkaline ladder of AC(40)-mer RNA (lane 2); TAR native (lane 3); TAR RNA complexes with IN-CT (lane 4); IN-CTD-ΔCT (lane 5); IN-CTD (lane 6) and Tat (lane 7). Digestion patterns were mapped on TAR secondary structure depicted on the right of the gel: circles identify nucleotides protected from RNAse T1 digestion and arrows mark the RNA cleavage sites. Grey arrows indicated nonspecific hydrolysis. The dimensions of arrows are proportional to the intensity of the band. (B) Real-time measurements of protein-RNA interaction by Interferometry (BLItz® System instrument, FortéBio). The 3′ biotinylated TAR (Bt-TAR) was first loaded on the streptavidin-coated biosensor for 120 s (Bt-association) then the unbound RNA was washed for 30 s (wash). The sensor was absorbed in a solution containing about 90 μM of IN protein for 200 s then incubated with different concentrations of Tat (0.2, 0.5, 1 and 2 μM) for 200 s. (C) Analysis of interferometry shifts as a function of Tat concentration (from data shown in Panel B). Data points were fitted with Hill equation: y = Bmax xn/KD + (xn): KD = 43 ± 2.2 nM (R2 = 0.99), n = 3 and Bmax = 0.57 ± 0.02 nm for Tat/IN-CTD (red curve) and KD = 13 ± 4.0 nM (R2 = 0.96) n = 5 and Bmax = 0.18 ± 0.02 nm for Tat/IN-CTD-ΔCT (blue curve). (D) BLI experiment to measure Tat binding to immobilized Bt-TAR RNA (green line) or immobilized Bt-RNA(30)-mer (grey line). Data points were fitted with Michaelis-Menten equation. Tat affinities are: KD = 1.49 ± 0.24 µM (R2 = 0.99) for TAR; KD = 3.84 ± 0.77 µM (R2 = 0.99) for RNA(30)-mer. (E) BLI experiments as in B and C, but with immobilised RNA(30)-mer to test Tat ability to displace IN-CTD or IN-CTD-ΔCT (see methods section for protocol). Data points were fitted with Michaelis-Menten equation. KD = 0.7 ± 0.1 µM (R2 = 0.99) for Tat/IN-CTD (red) and KD = 0.87 ± 0.2 µM (R2 = 0.99) for Tat/IN-CTD-ΔCT (blue).

