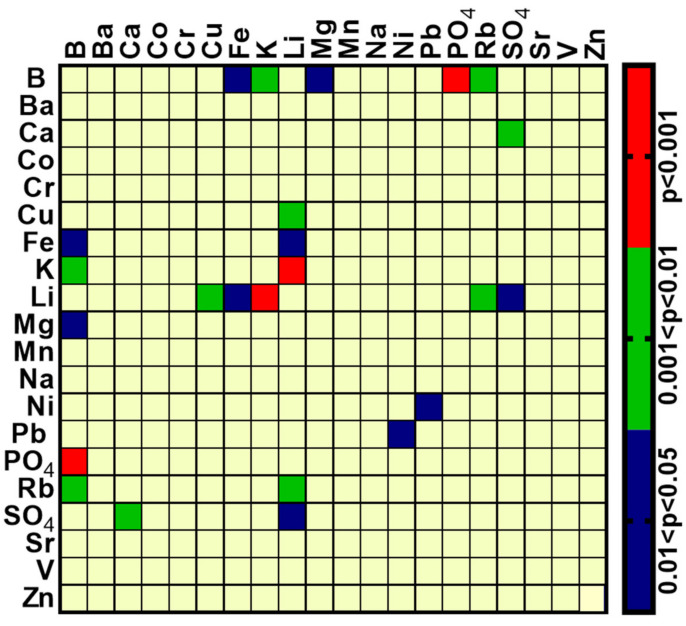
Figure 1.
Heat map of the comparison of Spearman correlation coefficients (rs) of element concentrations between serum samples of BD patients before and after treatment. The rs were computed for all pairwise comparisons, separately for the samples before and after treatment. The two-tail statistical significance of the difference between the rs of the two groups for each pair of elements was tested, as described in the results section; only those elements statistically different are shown, grouped according to the scale to the right.

