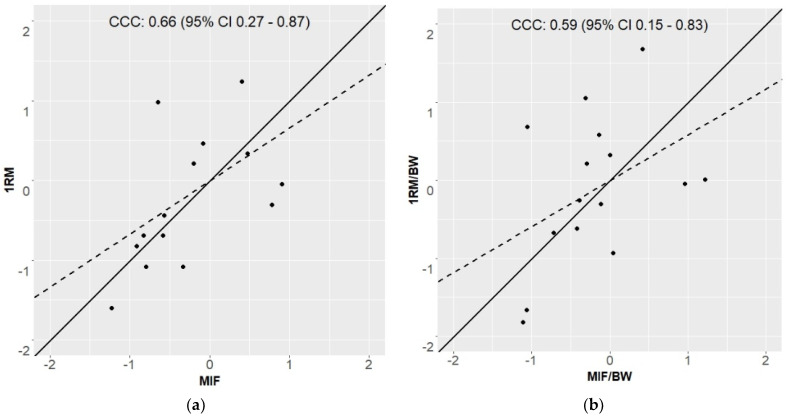
Figure 3.
Scatter plot of standardized absolute (a) and relative (b) strength/force performances. 1RM = one repetition maximum; MIF = maximal isometric force; BW= body weight; CCC = concordance correlation coefficient (ρc); 95%CI = 95% confidence interval; dashed line = 45° trend line; scattered line = linear trend line.

