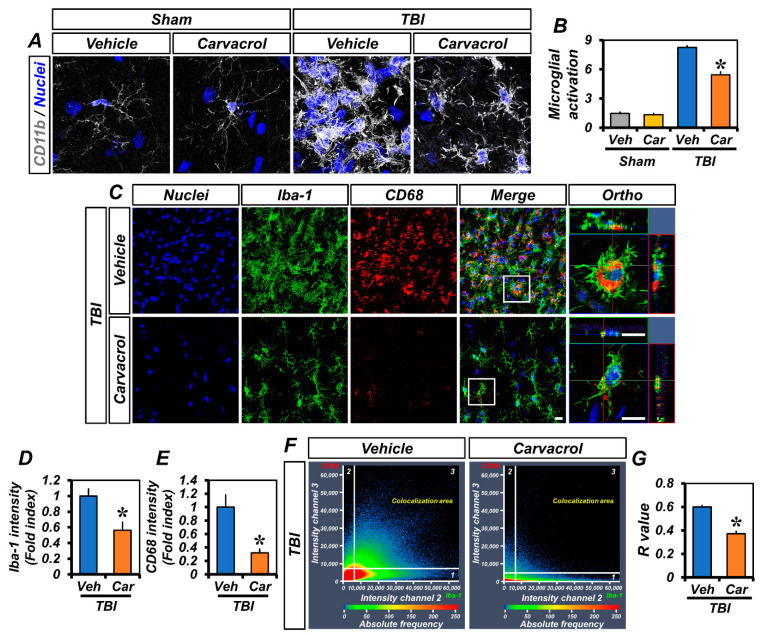
Figure 5.
Carvacrol reduced microglial activation after TBI: (A) Immunofluorescence images representing the microglial activation in the hippocampus of sham-operated and TBI groups (either vehicle or carvacrol) at day 7 as shown by immunofluorescence staining for CD11b (grey). Nuclei are stained with DAPI (blue). Scale bar, 5 μm; (B) quantification of the grades of microglial activation as determined in the same hippocampal region (mean ± SEM; n = 3–6 per group). * p < 0.05 vs. vehicle-treated TBI group (Kruskal–Wallis test followed by Bonferroni post-hoc test: CA1: Chi square = 13.480, df = 3, p = 0.004); (C) representative images of Iba-1- (green) and CD68 (red)-immunopositive cells, as well as merged images, for vehicle- and carvacrol-treated TBI groups. Nuclei are stained with DAPI (blue). Scale bar, 50 µm; (D,E) bar graphs showing the immunofluorescence intensity of Iba-1 (D) and CD68 (E), as determined in the same hippocampal region (mean ± SEM; n = 3 per group). * p < 0.05 vs. vehicle-treated TBI group (unpaired Student’s t-test); (F) co-localization scatterplots for CD68 and Iba-1; and (G) Mander’s overlap coefficient (mean ± SEM; n = 3 per group). * p < 0.05 vs. vehicle-treated TBI group (unpaired Student’s t-test).

