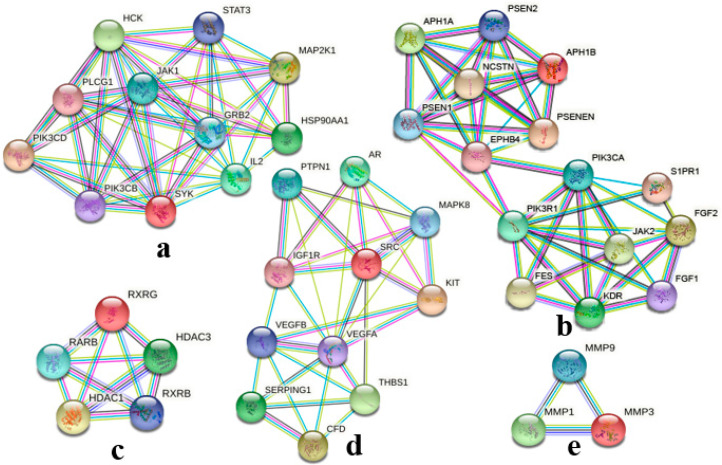
Figure 4.
Central gene clusters identified in the GCK–osteoporosis PPI network based on MCODE analysis ((a), (b), (c), (d), (e) was cluster 1, 2, 3, 4 and 5, respectively.). Colored lines represent the evidence which supports the interaction between different target proteins and the colored balls represent the different target proteins.

