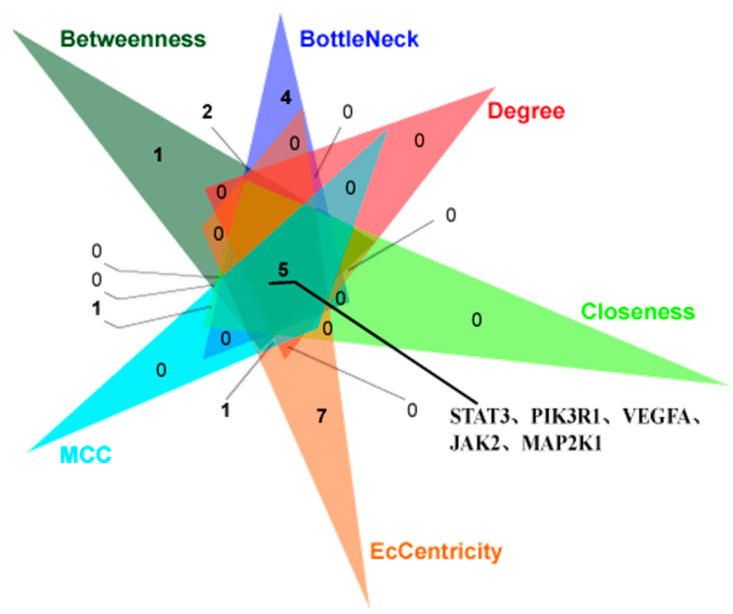
Figure 5.
Key genes identified in GCK–osteoporosis PPI network based on Betweenness, BottleNeck, Degree, Closeness, MCC and EcCentricity method through the cytoHubba plugin of Cytoscape software 3.8.0. Triangles with different colors represent the top 20 target proteins screened in GCK–osteoporosis PPI network through the different topological methods. In this figure, “5” represents the overlap of proteins which were identified by all methods.

