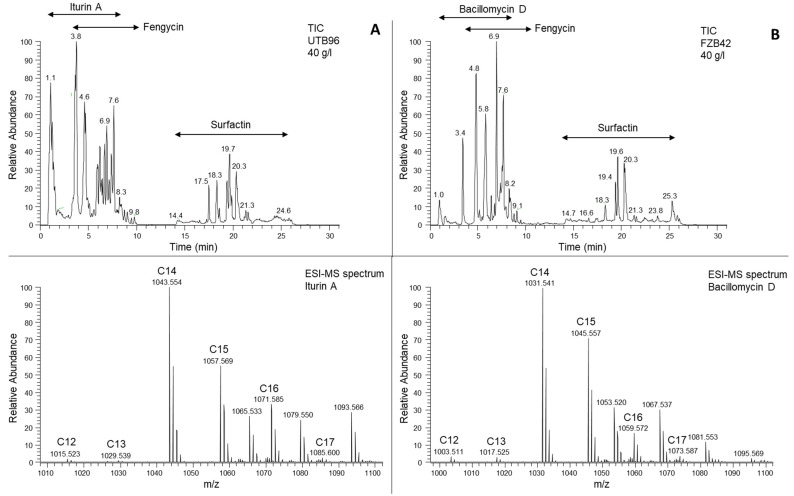
Figure 2.
LC-ESI-MS analysis of the lipopeptide compounds produced by the B. velezensis UTB96 and B. velezensis FZB42 strains. (A) Total ion chromatogram (TIC, upper panel) and ESI-MS spectrum (lower panel) of the extracted iturin A lipopeptides from B. velezensis UTB96. The ESI-MS spectrum shows m/z values of protonated iturin A lipopeptides [M+H]+ eluted in the time interval from 0.8–8 min. Fatty acid chain length of different iturin A lipopeptides is indicated. (B) Total ion chromatogram (TIC, upper panel) and ESI-MS spectrum (lower panel) of the extracted bacillomycin D lipopeptides B. velezensis FZB42. The ESI-MS spectrum shows m/z values of protonated bacillomycin D lipopeptides [M+H]+ eluted in the time interval from 0.8–8 min. Fatty acid chain length of different bacillomycin D lipopeptides is indicated.

