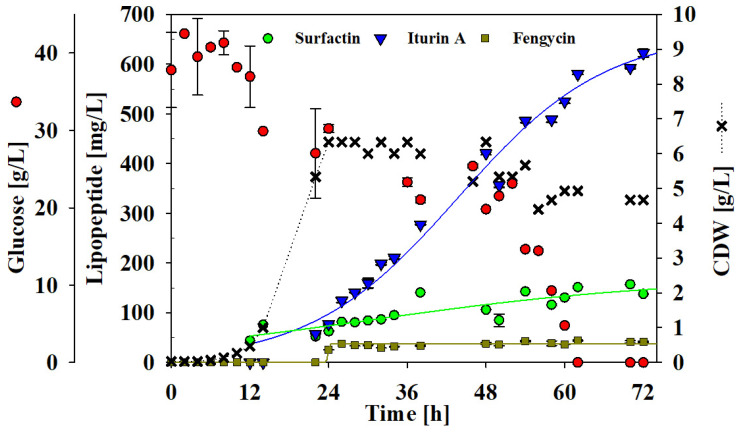
Figure 5.
Time course of the cell dry mass (CDW) of the glucose and lipopeptide concentrations during a batch bioreactor fermentation with strain UTB96, glucose (red dots), CDW (black crosses), and the lipopeptide concentration of surfactin (green dots), iturin A (blue inverted triangles) and fengycin (brown squares).

